Judy Romero

Why You Need to Understand Stock Float

Why You Need to Understand Stock Float

The stock float is one of the metrics that have the power to greatly influence the price of the stock. So make sure you get familiar with it if you plan to become a trader.

What Is a Stock Float?

To put it simply, the float of a certain stock is the measure of the number of shares that can actually be traded. So in a way, this metric is actually a measure of liquidity. And understanding the float allows the traders to predict the potential volatility of the stock.

General Recommendations Regarding Stock Float

If a stock has a high float, that means that it is more likely for traders to accurately predict its behavior. A large number of tradable shares means that the liquidity of the stock can support significant moves. With high-float stocks, such moves don’t impact the stock too much. However, low-float stocks can experience moves as huge as 40%.

For that reason, it is not always the best idea to trade low-float stocks. The price is reactive and the stock itself can be very volatile. That is especially true during the formative years of the life of a company.

A trader who knows what to look for can measure the goodwill of a company by looking at the float. Moreover, even a novice can measure the interest of the public in the stock. So in most cases, it is advisable to trade high-float stocks.

What Are the Differences Between Free-Float Market Cap and Market Cap

We can’t talk about the stock float without mentioning market capitalization. When you first start researching stocks, you might notice that company categories revolve around the market caps of those companies.

In essence, the market capitalization is a measure of the size of a company. Basically, it is the total value of the outstanding shares of stocks of a company. Those shares include both the publicly traded shares and the shares that are held by insiders.

Calculating the market capitalization of a company is rather straightforward. All you have to do is multiply the number of the outstanding shares of a company by the stock price. Allow us to illustrate with a simple example.

Let’s imagine a nameless company that has 100 shares outstanding. Now, let’s imagine that the company is trading at a stock price of $5. We can now calculate the market share by simply multiplying those two numbers. In our case, the number comes out at $500. Naturally, no company will trade with only 100 shares. In fact, stocks that have a market value of fewer than 250 million dollars are considered to be micro-cap stocks. And to enter a large-cap stock category, companies have to have a market value of over 10 billion dollars.

Now that we have an understanding of what market capitalization is, we can look back at the float. The float only numbers the outstanding shares that the public can trade. That means that the restricted stocks don’t enter the float.

To calculate the float of a company, we have to remove the inside trading shares. After all, they are of no use to the public, and they do reduce the liquidity of the stock. For that reason, major indexes prefer measuring the free float instead of the market cap.

Manipulating the Stock Price with Float

The market follows the rules of supply and demand. So if there are fewer shares available while the demand doesn’t change, the price will go up. And as the float is the measure of shares that the public can trade, people start wondering if the company can manipulate the float and thus impact the stock price.

While high-float stocks are more attractive for traders, reducing the float will actually increase the price. Studies have shown that companies are capable of manipulating the float to impact the price of a stock.

stock float manipulation

Companies can increase the float by issuing new shares. Conversely, they can reduce it by organizing a share buyback. Alternatively, some companies can use a stock split to impact the float.

Another way for companies to influence the float is through insider activity. In the case of a significant number of exercised options, the insider actions can change the stock float.

Furthermore, companies can simply choose to increase the float by selling inside shares. In most cases, companies do so in order to raise cash. However, that doesn’t exclude the possibility of ulterior motives.

And for that reason, investors should be wary of potential manipulations.

Posted by Judy Romero in Investing, Stock Market, Trading
How to Use Income Statements to Make a Profit?

How to Use Income Statements to Make a Profit?

Income statements are very important to all investors. However, if you are new to this, you might not know why. So, read on to find out why income statements are useful tools when it comes to making decisions.

The bottom line of every successful business is making a profit. So, if you are considering buying shares of a certain company, or if you are not sure if your current investment is working out, you will want to know how profitable they seem to be. And that is why looking at the income statement is important. With enough knowledge, the income statement will help you turn a profit with every trade.

What Is an Income Statement?

Well, before we even start answering that question, we should explain what income is. For any company or an individual, net income is the amount of money you get to “take home.” In essence, it is the money that is still there after all expenses are accounted for. And the income statement is the way companies figure out their profit numbers.

Some people also like to refer to the income statement as a P&L statement (profit and loss). After all, the net income can be either positive (profit) or negative (loss). That is why managers in internal accounting prefer to use the latter term. However, we prefer calling this statement an income statement as that is what SEC calls it.

So, to reiterate, the most crucial ability of a company is the ability to turn a profit. In the end, nobody wants to waste money on a company with negative net income. So, due to the nature of net income, the income statement is one of the most important aspects of trading. To put it simply – no matter how big a company is, the bottom line remains the same:

Profit = Revenues – Expenses

Revenue is the amount of money they bring in to the company, while expenses are the money they have to use to keep the operation going. The income statement will tell you what you need to know about those numbers.

And, sure, we know that some companies can be incredibly complex. However, the basic principle always remains the same. You get profit by subtracting your expenses from the overall revenues.

And, as a general rule, this is what income statements look like too, with slight variations. There are two kinds of income statements. The single step income statement and the multi-step income statement.

The former one follows the equation above to the letter. It is a very simple statement overall.

However, the latter type is a bit more complex. It actually differentiates between different kinds of activities. Namely, there are two kinds – operating and nonoperating activities. Operating ones are those that are fundamental to the business as such. So, if you are own a restaurant, the rent for the locale, the costs of making food and the revenue you bring are all operating activities. Nonoperating activities are pretty much everything outside of those. Of course, most publicly traded companies will use the multi-step statement.

What is Revenue?

Overall, revenue is the term that refers to the total amount of money a firm brings in. Of course, depending on the activities, some companies might refer to their revenues in different ways. Most commonly they speak of it as “sales.” Of course, there are other revenue items as well. The list includes rent revenue, interest revenue, and investment revenue.

The idea, however, always remains the same. Revenue is the amount of money the company can earn. Essentially, revenue is the gross income. You should also note that companies recognize the revenue they make as soon as they earn the money. For example, a company in the construction business will recognize the revenue as soon as they finish the job, even if they have to wait for a while to receive the money from the client. So, you should remember that even if the company has revenue, that doesn’t mean they have the money yet.

What Are Expenses?

The word “expenses” sounds self-explanatory. And it sort of is. The expenses of a company include everything that the company has to spend money on. Everything except investments – investments don’t count as expenses. But, back to the bottom line. The higher the expenses of a company are, the lesser the net income becomes.

However, understanding the expenses of a company can be a lot more important than just knowing the numbers. That is why a lot of income statements will separate the expenses by types. So, apart from general expenses, you will be able to see the expenses for research and development, the cost of goods they sell, and depreciation expenses.

Expenses can actually be a good thing for a company. Remember how you try to maximize your tax deductions every year? Well, companies like to do that too. So, instead of clinging on for the money, they will invest back into the company and grow the business.

Other Numbers

Income statements will usually include other items that can help you out. These advanced items can consist of comprehensive income or extraordinary items. You should, however, bear in mind that these don’t apply to every company out there. And, even if they do apply to a certain business, that doesn’t necessarily mean they are recurring. So, while it can be useful to know these numbers, you shouldn’t really treat them the same as the regular metrics.

Income Statement Analysis

Reading through the income statement is useful, but it will not do you a lot of good if you don’t know how to analyze it. So, we will help you out with that. Net income is something many refer to as the “bottom line.” But, what do you do with this number once you get it? How do you know if the number you are looking at shows promise or not?

Well, you should start by focusing on some important ratios and numbers.

Earnings Per Share – You might sometimes see it as an abbreviation EPS instead. You will usually find it right after the net income at the bottom of the statement.  This number tells you the amount of income per share of the company’s stock.

Price To Earnings Ratio – Now that you know how much money each share makes, you should check the P/E ratio. You do this by dividing the price of the share by the earnings per share. That will help you understand how the stock is performing. It might even help you predict the movement of the company.

Margins – The margin of a company is the profit when you present it as a percentage of the revenue. Low margins of a company are usually a sign that the company is vulnerable to supply price increases. If you are planning to invest, seeking out companies with higher margins is usually the best way to go.

Of course, don’t just make your decision based on these numbers. However, you should definitely factor them in while making your decision.

Horizontal Analysis

While going through the income statement of a company, horizontal insight is also a good way to go. Essentially, you should check the income data over a period of time to get a better picture.  So, if you see a company that has a net loss, but is closing in on a breakthrough and making a profit with each passing year, investing might actually be a really good idea. Alternatively, a company with a positive net income, but a downward trend, might start losing money in the following years.

Expectations

You should also consider the expectations. The management of the company will always try to predict how their income will behave in the future. And, while these are not always accurate, they can have a big effect on the value of the stock. For example, if a company performs far better than expected, the share of that company might rise.

The Conclusion

In the end, going through the income statement is essential while conducting a fundamental analysis of a company. So, make sure to learn how to be the one that makes a profit from the information in the income statement.

Posted by Judy Romero in Income

The Basics of Technical Analysis: Does it Really Work?

While technical analysis is definitely a useful tool to have, can you really turn a profit through pure technical trading? And how does it work? Even after years of popularity, there are still a lot of myths about technical analysis that have people scratching their heads.

Some people believe that simply drawing a couple of lines on a chart will turn them into millionaires. Well, that is definitely a myth. However, is technical analysis really the best thing to ever happen to traders or is it no better than tarot cards?

Traders like Ross Cameron of Warrior Trading and Dan Zanger of ChartPatterns.com preach the power of technical analysis.

One of the most polarizing subjects when it comes to trading is the infamous technical analysis. One camp can’t stop praising it, while the critics don’t seem to appreciate it at all. However, we did notice that many of the critics don’t seem to understand how technical analysis works. So, we will try to shine some light on it.

Of course, we won’t be able to solve a running debate that is as exhaustive as the one on technical analysis. But, we can help scratch the surface and prove some of the myths to be false, even if they are very popular in the world of trading.

But, first of all, we should define what technical analysis is. At its most basic level, it is the study of the market as such. So, instead of investigating the goods that trade on that market, and use that data to determine the worth of a security, you will analyze the market and gather your information that way. Those who use fundamental analysis will focus on the business of a company to estimate the price of the stock. Technicians, on the other hand, will follow the price and volume of the shares of that company. They will also focus on the supply and demand factors that are moving the shares around.

So, now that we have the basic idea of what technical analysis is, let’s bust some myths.

Myth #1: Looking at the Past Prices is Useless

One of the most common complaints you will hear about technical analysis is that you can’t use the past prices of a stock as a crystal ball and look into the future to find out what the prices will be. And, of course, there is no magic there. However, that argument has its flaws.

If you have ever bought a stock, you know how it feels when the prices of the stock start moving. You know how big of a thrill it is when your position starts climbing. And you know how bad it feels when you lose money on the market. Besides the emotional response that comes after a swing in the market is a good indicator of human behavior. So, while you can’t peek into the future,  you can guess what the initial response will be. After all, if you want to judge your current position, you will do so by comparing the current price with the price you originally bought the stock at. And, just like your past prices tell you how good your position is now, they can hint at what the future holds. The history of a stock definitely impacts how it will trade going forward.

Once more, there is nothing magical about it. Past prices don’t directly dictate the future. However, they are the best possible method of identifying actual supply and demand pockets that appear in the market.

So, now we know that the prices of the past somewhat impact the future prices. But, are technical charts enough to predict the future? Well, for us they certainly are not.

We are more than glad to concede that technical analysis will not predict the future for you. However, no technical trader actually believes that it works like a crystal ball. In actual trading practice, it is a way to find setups that have a high probability of happening. However, you use it in reaction to the movement of the market.

Being able to factor in potential limits of the stock’s price, the supply-demand ratio, and other market mechanics definitely helps. That is how technical analysis can help you determine highly-probable price movements.  Of course, charts won’t be able to predict the exact daily movement in the future. However, they don’t have to. All you actually require is assistance in getting good trades consistently. And you can use technical analysis to set your price targets and stop orders. And, of course, it can help you react to favorable movements on the market.

So, in the end, technical analysis will not suddenly turn you into a trader who is always right. But it will help you make money. Technical tools give traders the ability to profit from big market moves in a consistent manner.

Myth #2: Academics Don’t Believe in Technicals

One thing we have to notice is that academia doesn’t like analysis. However, they are not against technical analysis alone. The models that claim that technicals don’t work (for example, the Efficient Market Hypothesis and the Random Walk Theory) don’t only go against technicals. Under these models, no analysis tools really work – including the fundamental ones.

Of course, we should mention that newer research shows that there are serious flaws in the models in question. For example, research from 1996 shows that the Random Walk Theory is actually statistically impossible in the market. The fact that trends and market crashes exist goes against that theory. And studies have found similar results concerning the Efficient Market Hypothesis.

In the real world, the emotional response from the investors potentially carries more weight than the market movement itself. We could see this during the market meltdown of 2008.

And, most importantly, the experience of retail investors is showing that technical analysis works. New traders are proving every day that straightforward strategies, which come from technical analysis, reduce their risks. Not to mention that they improve the returns. And this stands for buy-and-hold trading, which proves that you don’t have to be a day trader.

Myth #3: The Most Successful Investors Avoid Using Technical Analysis

For some reason, it is quite common for people to believe that major funds or institutional traders don’t use TA. However, that belief is just not true. While the big investors tend to focus on fundamental research, almost every single company has a group of people whose only task is to conduct the technical analysis. In fact, institutions usually have floors with dozens of technical traders working for them.

And, we should also mention that those who work solely through technical analysis are very new on the scene. But, even with that in mind, some of the biggest investors became famous for their technical strategies. The list of technical traders includes the big names like Paul Tudor Jones and Richard Dennis. In fact, even some of the followers of the fundamental analysis praise TA. A research that was conducted at the University of Albany actually found that technical analysis gives the traders who use it a slight edge on the market, compared to the average performance.

The Conclusion

In the end, you should remember that it is wise to maintain a pragmatic approach to this type of trading. It is becoming increasingly popular with every year that passes, but some myths still remain. And misconceptions come from both pro and con camps. Using technicals to conduct your business can help you just as it did many others, but it does not give you a magical window into the future. And, we wouldn’t recommend using only one type of analysis. There is no reason not to combine the powers of fundamental and technical analysis.  So, even if you swear by fundamental analysis, there is no reason not to gain the further edge over the competition with the use of technical analysis.

Posted by Judy Romero in Technical analysis

A Beginner’s Guide to Low-Risk Stock Investing

Stock investing can sometimes seem quite mysterious, so much so that it often feels like a quest. You have to survive all the obstacles, and you have to use the right language. In addition to that, you also have to make sure that it stays available for valuable members only.

Inexperienced investors can easily put the entire industry in danger. However, most of the time they are a danger to themselves. Because of that, there are regulations that protect them so that they don’t get cheated out of their money. And, those regulations usually work well.

Nevertheless, when it comes to investing, a small group of people is the one that’s benefiting from your ignorance. Those are financial advisers, brokers and others who want you to ask them for advice – and pay a substantial fee for it.

Therefore, to help you, we’ve compiled a list of things you should know about investing. These facts will also help you if you are investing to save up for your retirement.

If you want to learn even more, you may want to consider paid education. This Warrior Trading Review explains how traders can benefit from joining a paid trading community. You will get access to a chat room with experienced traders and you will generally get access to their watch lists.

1. When you buy a stock, you buy the company as well

You’ve read that correctly. However, don’t get excited too soon. When you buy the stock, you are also getting more responsibility. The company has to inform you about all material changes that happen to it, but you also have to read about it and make your own judgment.

2. There are two ways you can profit

You might think that the only way to profit is by buying a stock at a low price and selling it for a higher one in the future. That’s called capital appreciation. However, you should know that there are also dividends, and they can be an excellent source of income. Combine that with the capital appreciation, and you have a thing called “total return.”

3. The stock value goes up and down

Never forget one simple fact: what goes up can eventually go down. And, let us remind you that going up serves no purpose if it doesn’t beat inflation. So, if you are planning to limit yourself to just one approach – think again. For example, value investing is when you buy a stock for a seemingly depressed price. Meanwhile, momentum investing is when you buy a rising stock and hope everyone follows your lead. These strategies can sometimes work, but the timing has to be perfect.

4. You cannot avoid taxes

Unless you have a qualified retirement account with stocks inside it, you will have to pay up for every gain you have and for every dividend you receive. Therefore, your total return has to go above the taxes and the inflation.

5. Volatility is a real thing

In contrast to No.3, here we’ll mention a thing or two about volatility. Whenever a security goes up and then drastically down – that’s volatility. It often happens to stocks, and it’s a fast movement on the market. Unlike bonds, stocks are rather volatile, which is why they can rise in value over long periods of time.

Lastly, the final thing you should concentrate on is diversification. Most companies thrive over the years. However, if you own a significant amount of stocks in a soon-to-be disaster company, you will lose everything. Therefore, it’s best to diversify and hold a variety of individual stocks. That way, you can protect yourself from bankruptcy, and you will be less affected when a company goes under.

Posted by Judy Romero in Stock

A Guide to Fundamental Analysis

Learn How to Explain Your Investment Analytically.

It doesn’t matter if you have a finance background or not. When you decide to use fundamental analysis, you can be your own stock portfolio analyst. Instead of just following your instincts, you can use this form of analysis to reach your goals and be successful.

Technical vs. Fundamental Analysis

Investors use two forms of analysis to determine their future investing prospects: fundamental and technical analysis.

The fundamental one takes the company’s corporate health into account. By using it, you will determine the stock’s real value and if it’s worthy of your time. Meanwhile, technical analysis does the exact opposite. Instead of looking at fundamentals, it tries to find out how the market will affect the stock’s progress.

Many investors, including the well-known Warren Buffett, have built their wealth by using fundamental analysis. Investing in unhealthy companies has never been their thing – so why should it be yours?

Business 101

Before delving further into the matter, you have to know a thing or two about business. More specifically, you should know what financial statements are. The three main ones are the balance sheet, income statement, and statement of cash flows. Without these, you won’t be able to assess the overall health of the company.

Think of it this way – a doctor cannot know what’s wrong with you if he doesn’t have your bloodwork. It’s the same with companies and financial statements. They have all the essential details you have to consider before investing.

The income statement tells you how much profit the company has actually made by subtracting the expenses from the revenue. Meanwhile, the balance sheet creates a comparison between the company’s assets and the stockholders’ equity and liabilities. The point is to have them balance each other – that’s where it gets its name from. Finally, the statement of cash flows tells you more about the company’s spending habits. It lists all the activities the company has spent money on (for example, operating costs).

These are crucial if you want your analysis to be successful. However, you cannot just use numbers to determine if an investment is worthy of your money. You also have to take qualitative information into account.

Hence, you should read the company’s annual report. It’s available to the general public, and you can read all about the company’s performance there. You will also find out more about its future endeavors.

You shouldn’t take this data lightly. It’s a chance for the management to explain why the numbers are high or low. Also, you can find out what you can expect from the company in the future.

A Word or Two About Performance

When it comes to performance, the stock price doesn’t really affect it – at least not when you’re doing fundamental analysis. Moreover, when deciding if a company is healthy or unhealthy, its performance plays a vital role.

You can use a variety of metrics to evaluate the performance. For example, if you want to know more about the company’s overall performance, you should look at the earnings. Meanwhile, if you want to see how certain assets have performed, then you have to look up these specific assets (for example, return on assets).

Some of the most useful metrics include price-to-earnings ratio and the gross margin. In addition to that, you should also check out the company’s earnings per share metric.

How to Compare Companies

It’s vital to know that companies are different, especially if they come from two different sectors. Hence, the results of the performance comparison won’t be absolute if you compare Google to U.S. Steel.

Google has a higher P/E ratio than U.S. Steel. But, that won’t give you much information about the performance. The basic materials sector cannot compete with the P/E of the tech sector, so it’s futile to compare them.

So, you should only use these metrics on companies that are actually comparable. They should come from similar sectors and industries. For example, you cannot compare eBay to the Bank of New York. They are not similar, which means that you won’t get the data you need.

However, you can compare eBay to Amazon or Yahoo!, or Bank of America and JPMorgan Chase to the Bank of New York.

Be a Pro

Day traders are able to generate huge gains fast. However, that’s not the point of fundamental analysis. This analysis allows you to find a fantastic stock, and use the financial advantages of an affluent company to grow your wealth.

The intrinsic value is far more important to fundamentalists than the market value. So, how do you become a pro at fundamental analysis? Sadly, there isn’t a definitive answer to this. It’s all trial and error, and even the most experienced analysts can make a mistake.

But, you can always practice and develop your skills further by benchmarking certain stocks. Thus, you can gain more knowledge about them and analyze the company’s performance. That will take time, but it’s the best way of finding out which “good” fundamentals you should take into account.

Practice it at Home

Here are a few things you can do at home to further develop your fundamental analysis skills:

  1. Pick two stocks – one you like and one you would prefer to stay away from. Look at their fundamentals, use them as the basis, and try to give an honest, objective opinion about both of them. Track their progress for about three months.


  1. Create a checklist and use it every time you’re analyzing a stock. It will be your own cheat sheet, and it should contain all the vital information about the stock in question. For example, all the important numbers and ratios. Thus, you will be able to review this data regularly and make sound decisions about your investments.


  1. Whenever you’re analyzing a stock, compare it to no more than one other company in the same sector or industry. This benchmark will be the first of many you will use during your career, and in time, you will create a mental library of benchmarks. Thus, you’ll probably have great success with fundamental analysis.
Posted by Judy Romero in Investment

A Beginner’s Guide -Six Stock Market Investing Tips

Bernard Baruch, “The Lone Wolf of Wall Street,” earned a seat on the New York Stock Exchange before turning 30. Furthermore, he became one of the most well-known financiers in the country by 1910. Although a master of his profession, Baruch didn’t have any illusions about the difficulties of prosperous stock market investing. According to him, the stock market’s main purpose is to make fools of as many men as possible. Ken Little, the author of 15 books on personal finance and investing, claims that every individual investor in the stock market should know that the system will always work in its own favor.

Still, hundreds of thousands of people are regularly buying and selling corporate securities on regulated stock exchanges or the NASDAQ. And some of them are actually successful. Luck isn’t the cause of a profitable outcome, but the utilization of some straightforward principles. These principles were developed from the experiences of millions of investors over countless stock market cycles.

Although intelligence is a great asset to whatever you do in life, it isn’t a necessary condition for investment success. A renowned Magellan Fund portfolio investor, Peter Lynch, said that everyone has enough mental ability to follow the stock market. According to him, everyone who can make it through fifth-grade math can do it.

Stock Market Investing Tips

People would love to find an easy and swift way to fortune and happiness. It is in our human nature to constantly look for a hidden key or a kind of arcane knowledge that will immediately lead us to the rainbow or result in winning the lottery.

Although it does occasionally happen that some people purchase winning lottery tickets or common stocks that quadruple in short periods of time, this is very unlikely. Only the most desperate or foolish ones would rely on luck as an investment strategy. When chasing success, we overlook some of the most powerful tools at our disposal: the magic of compounding interest and the power of time. If you invest regularly, avoid unnecessary financial risks, and let your money do the job for you over a period of a couple of years (and even decades), you will certainly collect significant assets.

Here are some tips that beginner investors should follow.

1.  Set Long-Term Goals

What made you consider investing in the stock market? When will you need your money back? In six months, a year, or more than five years? What are you saving for? Is it for future college expenses, retirement, to buy a house, or do you maybe plan to build an estate?

Make sure that you know your purpose before investing. Also, you should know when you will need your money in the future. Those who might need their investment returned within the next couple of years should consider other types of investment. Volatile as it is, the stock market cannot provide any certainty. So, you might not be able to take your capital back when you need it.

If you know how much capital you will need, and when in the future you will need it, you can easily calculate the amount you should invest. Also, you should know what type of return on your investment will be required to put together the desired result. There are free financial calculators available online. They could help you estimate how much capital you will need for future college expenses or retirement.

You can find various retirement calculators at Bankrate, Kiplinger, and MSN Money. Depending on your needs, you can either use simple ones or more complex ones. For college cost estimates, use calculators available at TimeValue and CNNMoney. Numerous stock brokerage firms provide similar calculators.

There are three independent factors on which the growth of your portfolio depends upon:

  1. The capital you decide to invest
  2. The amount of net yearly earnings on your capital
  3. The number of years of your investment

It would be best to start saving sooner rather than later. Save as much as possible, and then receive the highest return you can, in accordance with your risk philosophy.

      2. Know Your Personal Risk Tolerance

Risk tolerance is a genetically-based psychological trait, positively influenced by income, wealth, and education (your risk tolerance increases slightly as these increase) and negatively by your age (your risk tolerance decreases as you get older). Basically, it is what you think about taking risks, and how anxious you feel when there is risk present. Ask yourself to which extent you are willing to risk coming up against a less favorable outcome in the pursuit of a more favorable one. Would you be willing to risk $100 to win $1,000? Or $1,000 to win $1,000? People have different risk tolerance, so there is no “correct” balance.

Your perception of risk will also affect your risk tolerance. Back in the early 1900s, riding in a car or flying in an airplane was considered very risky. However, we don’t consider these things as risky today, since they are common occurrences. However, the majority of people today would feel that riding a horse could be dangerous. People would say there is a good chance one could fall or be bucked off. We think this way because we don’t spend a lot of time around horses anymore.

As you can see, perception is important, especially when it comes to investing. When you start learning more about investment – for example, how to buy and sell stocks, how much price change is usually present, and the ease or difficulty of liquidating an investment – you will probably realize that stock investments have less risk than you initially thought. Consequently, you will feel less anxious when investing, although your risk tolerance will be the same, as your risk perception has developed.

When you finally understand risk tolerance, you will be able to avoid investments that are probably going to make you anxious. In general, there is no point in owning an asset that will keep you up at night. Anxiety easily leads to fear, which then triggers various emotional responses (contrary to logical responses). If you can keep a cool head in periods of financial uncertainty and go through an analytical decision-making process, you will always come out ahead.

    3. Manage Your Emotions

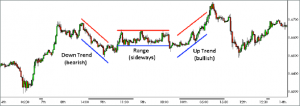
One’s lack of ability to control personal emotions and make objective decisions is the biggest obstacle to making stock market profits. Companies’ prices, in the short-term, reflect the emotions of the whole investment circle. When there’s a certain company that worries most investors, its stock price is bound to decline. And when the majority feels good about a company’s future, its stock price will probably rise.

We call someone who feels about the market in a negative way a “bear.” A “bull” is their positive counterpart. There is an ongoing battle between the bears and the bulls during market hours. This battle is reflected in the constant change of securities’ prices. All of these short-term movements are affected by emotions – speculations, rumors, and hopes. It is advised that you use logic – a systematic analysis of one’s company’s assets, prospects, and management.

When stock prices move contrary to our estimate, that creates insecurity and tension. One starts to wonder:”Should I sell to avoid loss? Will the price rebound and should I then keep the stock? Should I purchase more?”

Even when a stock price performs as you expected it, questions arise. Should one take the profit before the price falls again? As the price is likely to go even higher, should one keep their position? Such thoughts can overwhelm you, especially if you keep watching security prices, trying to decide if you should take action. But, bear in mind that when emotions drive your actions, you can easily be wrong.

Always have a good reason for buying a stock, as well as certain expectations regarding the price. Also, decide on a point at which you will put your holdings into liquidation, if the reason proves to be invalid, or the stock doesn’t perform as expected. Before you purchase the security and execute your strategy unemotionally, always have an exit strategy prepared.

4. Handle the Basics First

First things first – learn the basics of the stock market and that market’s individual securities before making your first investment. Remember the saying: ”It is a market of stocks, not a stock market.” So, your focus will be on individual securities, unless you are buying an ETF (exchange-traded fund). It rarely happens that every stock moves in the same direction. Sometimes the averages fall by a hundred points or more, and some companies’ securities go higher in price.

Here are the fields you should be familiar with before you make your first purchase:

  • Different Kinds of Investment Accounts. Cash accounts are the most usual ones, but margin accounts might be required by law for some types of trades. Make sure that you know how to calculate margin and that you understand the difference between maintenance and initial margin requirements.
  • Popular Methods of Timing and Stock Selection. It is vital that you know how technical and fundamental analyses are performed, what is the difference between them, and in which stock market strategy is each used.
  • Financial Definitions and Metrics. Know the definitions of metrics. For example, the P/E ratio, return on equity (ROE), earnings per share (EPS), and compound annual growth rate (CAGR). Knowing how to calculate them and being able to compare various companies that use these metrics is crucial.
  • Stock Market Order Types. Investors use various types of orders. For example, limit orders, market orders, stop limit orders, stop market orders, trailing stop loss orders, etc. You should be able to understand the difference between them.

Keep in mind that risk tolerance and knowledge are linked. According to Warren Buffett, risk comes from not knowing what you’re doing.

    5. Diversify Investments

Buffett, as well as other experienced investors, avoids using stock diversification as they are confident that the research they performed is sufficient to recognize and quantify their risk. They believe they can spot potential dangers and put their investments into liquidation before facing terrible loss. Andrew Carnegie said:”The safest investment strategy is to put all of your eggs in one basket and watch that basket.” But be careful; you are neither Buffett nor Carnegie, especially in the beginner stage.

You can diversify your exposure in order to manage risk; it is one of the popular methods. Sensible investors have stocks of various companies in various industries, sometimes even in various countries. That is because they believe that an isolated unfortunate event won’t affect all of their holdings, or at least not to the same degree.

Think about this: you own stocks in five different companies, and you expect all of them to continually increase profits. However, circumstances change. When the year ends, two of your companies performed well, and their stocks grew by 25% each. Other two companies’ stocks in a different industry grew by 10% each. Finally, the fifth company’s assets were put into liquidation in order to pay off a huge lawsuit.

Diversification lets you recover from the loss of your entire investment. Imagine if you have invested solely in the fifth company; the outcome would have been much worse. This way, the value of your portfolio dropped by only 6%.

    6. Stay Away from Leverage

When borrowed money is used to execute your stock market strategy, that is called leverage. If you use a margin account, you can take money from brokerage firms and banks to buy stocks, normally 50% of the purchase value. Simply put, if you want to buy 100 shares of a stock trading at $100 for a total cost of $10,000, a brokerage firm could give you $5000 for the purchase.

When you use the borrowed money, it “levers” or overemphasizes the result of price movement. Imagine owning a stock that moves to $200 a share which you decide to sell. The return would be 100% on your investment if you had used your own money. But, if you had borrowed $5,000 for the stock and sold it at $200 per share, the return would be 300% after you repay the loan and exclude the cost of interest paid to the bank or the broker.

That sounds great if the stock moves up. However, consider the other possibility. If your stock fell to $50 per share, then your loss would be 100%. You would lose your initial investment and have to pay the interest to the broker.

Leverage is neither good nor bad. It is a tool recommended to experienced investors who are confident in their abilities to make logical decisions. It is best to limit the risk at the beginning so that you can ensure profits in the long run.

Conclusion

In the course of history, equity investments have enjoyed significant returns, much more than other types of investments. Furthermore, they are easy to liquidate, and they have total visibility, as well as active regulation to make sure the same rules apply to everyone. If you are willing to consistently save, manage your risk appropriately, invest energy and time to gain experience, and be patient, investing in the stock market is a great chance to build large asset value. In order to achieve greater final results, it is better to start sooner rather than later. Keep in mind that you are a beginner; don’t skip any of the necessary steps.

Posted by Judy Romero in Stock Market

Day Trading 101: Use These Strategies to Make a Profit

Day traders are those that buy and sell an instrument during the same day. Some even do it many times over the duration of the day. That way, they can easily profit from the price movements that occur during the day. However, this type of trading is not without risks. While it can be a lucrative venture, lack of knowledge or experience can cost you a lot of money.  That is why you should, at least in the beginning, stick to the tried-and-true strategies and methods. That’s why we will take a look at some principles you should definitely adhere to. So, to help you on your way, we will go over the top ten day trading tips for beginners. First things first, make sure you have a solid broker like Ally Invest. You’ll also want to make sure you have access to a quality trading platform.

Top 10 Tips

1. Do Your Homework:

Remember, knowledge is power. And not just knowledge of how trading works. If you want to be successful, you have to follow the stock market news and any event that can affect the market. Use any information you can find. Always make sure to do your homework. That includes making a list of stocks you would like to buy, informing yourself about that stock on a regular basis and keeping up with the news. You should also visit trustworthy websites with reliable financial information as often as you can.

2. Set Aside The Amount of Money You Are Willing to Spend:

You should know how much money you are willing to risk in each trade before even starting your day. We would recommend setting aside the amount that is no bigger than 1-2 percent of your account. Remember, you will lose money in trades, no matter how good you are. Remember, even Warren Buffett doesn’t have a 100% success rate. And you don’t want to risk a large percent of your account on a single trade. So, make sure to set aside the money you can trade with. And be ready to lose that money. We are not saying you shouldn’t be optimistic, but don’t take away from the money you require for your living expenses.

3. Make Sure You Have Enough Time

Day trading can, without a doubt, be a very lucrative trading style. However, you should bear in mind that it will take up most your day. If you don’t have a lot of spare time, you should consider a slower trading style. Reacting to the market movement is crucial and missing out due to the lack of time can cost you a lot of money.

4. Don’t Overdo it

As a newcomer in the world of trading, you should remember not to make too many trades in a day. So, try to focus on a couple of stocks for the first few weeks, at least until you get some experience.

5. Avoid Penny Stocks

We understand that trading low-cost stocks seems ideal for a new trader. However, penny stocks usually lack liquidity, and it is not easy to make a profit with them as a beginner.

6. Let Others Trade First

Day trading can be very volatile, and this is very noticeable during the first 15 minutes of each trading day. A lot of people will execute their orders as soon as the market opens. And this practice increases the volatility of the market. Once you have some experience behind you, you will be able to profit from this volatility. However, until then, you should avoid the rush hour and trade during the milder moments of the day. Take your time, and read the movement of the market.

7. Use Limit Orders to Cut Your Losses

There are two main types of orders you should use as you are starting out – market orders and limit orders. Market orders guarantee execution, however, they don’t guarantee the price. This order executes the trade at the best price it can get at the moment. On the other hand, limit orders demand the right price but don’t guarantee the execution. Use limit orders to trade with precision and set the price you want. Make sure to set realistic prices for trading to avoid missing out on the trade.

8. Keep Your Expectations in Check

Some people imagine that every single trade has to be a win to make a profit. Others expect incredible outcomes after just a couple of trades. And, we have to tell you, neither of those is necessarily true. In fact, many successful traders have success rates that barely go over the 50% mark. However, they focus on making more money on winning trades than they lose on their losing ones. That is why risk management is one of the most important aspects of trading. So, don’t get discouraged if some of your trades end up losing you money. Just take your time and develop a strategy that lets you get more than you lose.

9. Control Your Emotional Response

Trading in the stock market can get very emotional. You might get overly optimistic, hopeful or fearful, depending on the day. But don’t let your emotions take the lead. In the end, use your logic to make the decisions.

10. Always Stick to Your Plan

Make sure you have a plan before you start placing orders, and stick to it. As a day trader, you will have to move fast to grab a good trade. However, you don’t have to put yourself in the position where you have to make snap decisions. Don’t blindly chase profits if that trade goes against your overall plan. Instead, develop your formula and follow it as closely as you can.

Buying For Beginners

As a day trader, you will try to make a profit by using the small price movements during the day. However, there are factors you should always consider when entering a trade. Typically, you should look for liquidity, volatility, and trading volume of a stock. Allow us to explain:

* Liquidity – Stocks with a lot of liquidity usually have tight spreads. That means that you can both enter and exit a position with a good price.

* Volatility – Volatility is a measure of the price movement of a stock. If a stock is very volatile, it means you can gain, or lose, more money.

* Trading Volume – This measure will tell you how many times a stock has been traded in a certain time period. Usually, you should check for a period of one day. You can use this to measure the interest in a certain stock. If the volume increases, it usually means that the price will change too.

Once you have a grasp of these measures, it is time to find what your entry point should be. For this, you should use the following three tools:

* ECN/Level 2 Quotes: ECNs represent the electronic network that will automatically execute orders for you. Level 2 quotes are a service that will get you price quotes from NASDAQ and OTC securities. Use these two in conjunction to vastly improve your chances. It might take you some time to get a good handle on how to use these.

* Live News: Stock prices are always changing. And one of the biggest catalysts for that are news. Subscribe to real-time services to make sure you are in the loop.

* Candlestick Charts: Use these charts to analyze action prices. More on them later.

Selling For Beginners

Once you find the stock you want to buy, it is time to make a plan for the exit point. Namely, identify your price target. Once the stock reaches that target, leave the position. There are numerous strategies when it comes to price targets. Let’s go through them:

Scalping: This is probably the quickest strategy to perform. And, for that reason, it is one of the most popular ones. With this strategy, your price target is met as soon as the trade becomes profitable for you. In essence, you set the price target by planning to sell as soon as the numbers show you will make any money.

Fading: If you see a stock experience several rapid upward moves due to overbuying, you should consider this strategy.  As soon as the stock spikes, the early buyers will start turning profits, and others will avoid the higher price. So, once it goes up, you start shorting the stock to turn a profit from the subsequent price drop. This strategy is risky, but it can be very profitable. Set the price target as the moment new buyers start buying the stock at the lower price.

Daily Pivots: With this strategy, you will be looking to profit from the volatility of the stock. Follow the price patterns of stocks and notice when the prices are at their lowest. Buy at that point, and sell when they are at their highest. Set the price target at first signs of reversals.

Momentum: If you opt for this strategy, follow the news closely. Your goal is to recognize the news that will trigger an increasing trading volume of a stock. Buy on the release of the news and sell once the volume starts decreasing.

The Candlestick Chart

We said that you should use the candlestick chart to find your entry point. Well, this is how to do it. Start by focusing on patterns, technical analysis, and volumes. Of course, there are way too many setups you could run for us to instantly cover. However, one of the most reliable ones is the doji reversal pattern. The doji candle is the one that is signaling the reversal. This is how you can try to confirm this pattern:

  1. The first confirmation is a volume spike. The spike shows that there are traders that will support the price. The spike can be on the doji candle or on those that come immediately after.
  2. Check if the prior support levels match up.
  3. Check the level 2 to see what the open orders have to say.

Margin Trading and Stop Losses

As a margin trader, you will be borrowing the funds for your investments from a brokerage. If you become a margin trader (which is not easy), you will be vulnerable to sudden price movements. In essence, margins amplify trading results. So, if you make a profit, it will be bigger. However, the same goes for your losses too. So, using stop-loss orders is crucial for day traders.

This type of order will greatly reduce your risks. And, you can set the stop-loss to any metric you want. If you are entering a long position, set it just below a recent low point in price. Or, if you decide to enter a short position, set it above a recent high.

Alternatively, if you are afraid of market volatility, you can design a stop-loss order that will protect you from it. If the stock’s price is moving up and down every minute, you can place a stop loss at a certain distance away from your entry point. Make sure to leave some breathing room as the price fluctuates.

We should also mention that a lot of traders like setting up two stop-losses. A physical stop loss is the one you place at the point at which you would lose the most money you are willing to risk on this trade. A mental stop loss is the one you set at the point where the movement breaks your entry criteria. In essence, you set it up to exit the position the moment your trade makes an unwanted turn. Just make sure that the exit criteria are very specific.

Final Remarks

Mastering day trading can be a daunting task. It will take a lot of time and discipline on your end. In fact, many who try to do it either fail or give up. The fast-paced environment and the pressure that comes with it can prove to be too much for a lot of traders. But, if you utilize the tips and strategies you can find above, you might make a strategy that will turn a profit. After you get enough experience to be a consistent trader, you should be able to beat the odds. And, if it gets tough, just bear in mind that you can always try again tomorrow.

Posted by Judy Romero in Trading

Day Trading Guide

There is a reason every brokerage desires to have as many active or day traders as possible. They usually have a lot of experience and don’t require a lot of assistance compared to newcomers, not to mention that they generate a lot of revenue for the brokers every day. Of course, the terms don’t have strict definitions. So, how many trades do you have to make to become a “day trader” or an “active” one?

We did speak to a number of brokerages, experts, and investors to see if there is a definitive answer. And, it does seem like there isn’t an exact number where “active trading” starts, especially since every broker seems to have a different set of rules when it comes to that. Rules that usually depend on their prices and costs. In fact, one of the brokers who deals with active traders even thought up a new term of “hyperactive trading.” The broker in question is Lightspeed, and they believe that people overuse the term “active trading.” So, they distinguish between active traders and hyperactive ones. The former would be those who place 10 or more trades per month, while the latter would be those who place at least ten times that volume.

So, let’s take those numbers and go with them. To become an active trader, you would have to place around 120 trades, or more, every year. However, to qualify to become a hyperactive trader, the number is much larger. You would have to place at least 1,200 trades per year or more. So, figure out in which of these two categories you fit in better before you go on to choose your broker.
Top 5 Platforms for Day Trading
As we have said, in order to choose the best broker for yourself, you need to understand where you fit in. If you are an active trader, paying up to 7 dollars per trade should be acceptable. Finding a low-fee service is desirable, but you also require a platform that has a lot of features. After all, research is fundamental in trading. That means that you should be willing to pay a bit more per trade for access to those features.

On the other hand, if you are a hyperactive trader, it is not as important. We spoke to a number of hyperactive traders, and they say that the costs and the speed of execution are the most important factors. They believe that flashy tools and intricate research are simply not that crucial to them. So, when we were making our list of the best day trading platforms, we kept those in our minds. But, without further ado, these are our five picks for day traders.
5. Fidelity – 9/10
4. TD Ameritrade – 9/10
3. Lightspeed – 10/10
2. TradeStation – 10/10
1. Interactive Brokers – 10/10
Let’s start out with our number one pick for this list. Interactive Broker is a clear winner when it comes to the needs of day traders. This broker caters to both subcategories of active traders. If you choose them, you won’t find a beginner friendly platform. In fact, we wouldn’t recommend it for new investors. And it doesn’t boast impressive research features. However, you will see that they have everything you need for day trading. Highly customizable hotkeys that you can program for a variety of actions. Pre-set order types that will let you place any imaginable trade. They even include algorithmic orders in there. And, they offer the lowest margin rates you will find. Not to mention that their commissions are the most affordable in the industry. All of this makes the platform also popular among hedge funds and institutional traders.

We should also mention that this broker, along with Lightspeed and TradeStation, offers something called “unbundled” rates. That term refers to rates that include all of the rebates the brokerages get for your trades. In essence, a lot of exchanges will offer rebates to your brokerage for routing your transactions to them. And these three brokers will pass every penny of those rebates on to you. Now, to be fair, these rebates are relatively small amounts of money. Usually, you would have to go through 10 shares to get a single penny. However, after a year of trading, the numbers add up. In essence, these rebates will reduce the amount of money you have to pay per trade.

Let’s use Lightspeed as an example. If you’re using Lightspeed to trade a 1,000 shares on the NYSE, the rebate will be 0.14 pennies per share. At the same time, the commission rate you pay to Lightspeed is 0.45 pennies per share. So, trading a thousand shares would end up costing you $3.10 instead of $4.50. Now, if you are a hyperactive trader with 2,000 trades per year, this can add up to $2,800 of a difference in that year alone.

On the other hand, you could go with one of our other top brokers. TradeStation, for example, has three different structures when it comes to commissions. TD Ameritrade boasts the thinkorswim desktop platform which is basically second to none, and a mobile app to boot. And Fidelity is on the list thanks to their order execution quality.
Tips for Choosing Your Broker
Overall, finding the perfect broker for your needs mostly depends on how you plan to trade. For starters, decide how many trades you plan on making per year in advance. Then, try to decide between powerful tools and low commissions. And, don’t forget to check the minimum deposit values. In the end, the rest is up to you.

Posted by Judy Romero in Trading

Financial Statements and How to Read Them

Before you invest in a stock, you should definitely read financial statements. However, before you do that, you will have to learn how to read them correctly.

The very first thing you should notice, of course, is the EPS – earnings per share. Of course, this is the facet of the financial report everybody anticipates and tries to figure out. So, of course, if you are researching a stock, the EPS is probably the best way to start. People commonly refer to the EPS as the bottom line. And they do so for a good reason. It is the facet that represents the profit and loss of a company.

Naturally, the headlines in most media outlets will usually focus on the EPS. And, while it is the most important metric, it is still only one of the components you should focus on. Namely, there are two more crucial components in regards to a financial statement of a company that you have to understand.  Namely, the statement of cash flows and the balance sheet.

Of course, reading an online article will not turn you into a pro. However, it will help you understand the information you are getting. So, you can maybe save some money you would otherwise spend on consultants.

So, let’s start off this online lesson about financial statements by taking a look at the 10-K and annual reports.

Preparing for the lesson

As always, if you plan to conduct an investigation, you should first aggregate the data you expect to use. In essence, collect the materials you require to build the basis of your inquiry. However, what information should you be looking for, and where should you check?

Well, for starters, you should always check the 10-K and 10-Q forms as well as the annual report. Usually, all of those documents are easily accessible. Simply go to the investor relations option on the website of the company that you are investigating.

Form 10-K

The company makes this official filing to the SEC. The 10-K will usually have these sections:

* Overview of the company

* Overview of the financial data

* Information about the director and the senior management

* Executive compensations

* Consolidated financial statement that includes reports of an independent accounting company

* Other information

Form 10-Q

This is the “mini-me” version of the previous form. It is a quarterly form that includes financial statements without audits and notes about those financial statements.

Annual Report

The company sends this publication to all of its shareholders. Most companies will also make the annual report available for potential investors. Of course, not every company will make the same annual report. Some put a lot of effort into it, while others just add a few words to their 10-K form. Let’s cover three examples that vary depending on the amount of energy:

Low Effort: For example, Ruth’s Chris Steak House will put next to no effort into their annual report. Most of the time, they will just use their 10-K with a glossy cover.

Medium Effort: Somewhere between the two examples are those that offer a decent annual report, but in the end refer people to their 10-K. As an example, we will use the Duke Energy company. Their annual report offers a business overview and consolidated financial statements. However, they do still rely on their 10-K to do the talking.

High Effort: An example of a company that puts in a lot of effort into their annual report would be Amylin Pharmaceuticals. They hire professionals to design their annual reports and even incorporate a message to their shareholders. They also include the business overview that features (but doesn’t limit itself to) the management of the company, the products they offer, new projects they are starting, and the way they operate. You can also find the report from auditors, consolidated financial statements, and notes for all of those.

A Step by Step Guide on How to Read These

Ok, now we have gone through the reports you should acquire. However, we still haven’t shown you how to address the information you can find in these. So, these are the steps to follow in your investigation.

Step 1 – Find Reports From the Independent Accounts

The first thing you want to find out is if the company’s records and statements are presented in a fair and an appropriate manner. You should also find out if they are in line with the GAAP (Generally Accepted Accounting Principles). That means that you will have to make sure that the company did receive an unqualified report. Companies that receive this report are companies that have no items that could cause a GAAP exception, and the financial conditions of the company don’t indicate any possible issues regarding the company’s existence.

This report will usually open with the general information about which company it concerns, as well as which period of the company’s history the independent auditors are auditing. They will usually go through the consolidated statements of operations, the equity of stockholders, and the cash flow of the company. It is very important for this report to state that the financial statements of the company are fair in their representation of the financial situation of the company in question. The report should also mention any changes that the company went through lately. So, if the company changes the method of accounting for their payments, you will be able to find it in this report.

It is very important to go through this report to find if there are any red flags that should worry you. Make sure to read the entire report to check if any irregularities might be a cause for concern.

Step 2 – Read the CEO’s Letter

A majority of annual reports will include the letter from the chief executive officer of the company. And you would do well to read it. As you probably already know, the CEO is the actual leader of a company. As such, the CEO will be the one that manages the operations of the company and sets the plans for its future. So, you should definitely want to know what the CEO has to say. This letter will usually talk about how the company started, how it is doing right now, and what the plans for the future are.

Since these are personal notes from the CEO, no two letters from the CEO are the same. Some of them will be there to advertise the company as it is and praise its workings. On the other end of the spectrum, you will have CEOs who are very critical of the situation. They will focus on the mistakes that happened in the past, and the changes they are making to avoid those mistakes. They will also tell you what the challenges of the future are. Overall, you should always take the time to read the letter of the CEO.

Step 3 – Read the Overview

Companies don’t always remain the same throughout their history. They usually go through various changes. As always, the demand is the factor that dictates the strategy alongside market conditions in the world. And that goes for every company and every industry out there. You, as an investor, are the one paying for the expansion of the company. So, make sure to read the business overview to see what the future plans are. After all, you want to know what your money is going to do for the company. The overview will also give you the general idea regarding the current products of the company and the position in the competitive nature of the market.

The Conclusion

In the end, you can probably notice that there is a lot of homework you would have to do before you even start analyzing the numbers. So, before you go on with your trading day, choose any company, regardless if you are a stockholder in that company, find their annual report and 10-K forms and try to analyze the data you see there. This way, you can formulate your own opinion about where the company is going instead of relying on various analysts to do it for you.

Posted by Judy Romero in Financial Statement

What Can You Add to Your Portfolio?

Investment Ideas & Where to Find Them

There are many sources you can get investment ideas from. You could find an idea in the library, and even in the store that you visit every day. Furthermore, it doesn’t matter if you have enough experience or not. Many investors are searching for individual stocks they can add to their portfolios. However, that sort of quest is sometimes quite tricky, and they don’t even know where to start.

Hence, we’ve compiled a list of four tricks you can use to find investment ideas without too much trouble.

1. Flip through the Standard and Poor’s guides

If you’re struggling, you can always read the financial guides S&P releases every year. There are three of them, and they consist of two pages each. In them, you will get information about 1,500 companies that have different indices: small, mid and large cap.

S&P adds all the necessary information about the companies in their guides. For example, phone numbers, ticker symbols, dividend records, and a short business summary, among other things. You will also get historical data from these guides, which will help you decide if the stocks are a good investment or not.

However, you don’t have to listen to the trading advice S&P gives you in the guides. Instead, you should examine the earnings growth, levels of debt, and the equity rates return in the past couple of years. Then, you can use a simple scratch pad to list all investment ideas you’ve thought of.

Afterward, it would be wise to call the companies and ask for more information about their endeavors. Also, you can always order their annual reports and gain more information about the companies that way.

2. Use the Value Line Investment Survey

If you want to access all the essential facts and figures, you can always use the Value Line Investment Survey. You can subscribe for $500+ and have unlimited access to it. However, if you don’t have the money, just go to your local library – they are bound to have the subscription. Then, you can just read the reports and make a note about the companies you’re interested in.

3. Go to Your Local Store, Mall or Gas Station

You can find incredible investment ideas in places you frequently haunt. Just grab a piece of paper and look for products that might be interesting – for example, Coca-Cola, Hershey’s Chocolate, and Tide. Grab the product and find information about the manufacturer on the packaging.

You can call each company and ask if it’s publicly traded. If the answer is “yes,” then ask them to send you the annual report. They will probably transfer you to a different department (investor relations). Give them your personal details (name and address), and you will get the report free of charge.

4. Ask Your Family

Your spouse and your children probably have a few good ideas as well. If you need an example, then take a look at Peter Lynch. He admitted that his family had given him a few investment ideas.

When his daughter bought a lot of clothes from one store, he began thinking about that store as a potential investment. In addition to that, his wife once bought a pair of pantyhose from L’eggs. Afterward, he decided to invest in Hanes, the manufacturer of that product.

Posted by Judy Romero in Investment