Trading

Artificial Intelligence Solutions For Maximum Trading Results

Artificial Intelligence Solutions For Maximum Trading Results

The Evolution of Trading
A.I. Trading Technology needed to create a true revolution in trading technology on a scale the market had never seen before. We wanted to create trading systems that could study the market, learn from large quantities of data, adapt to the dynamic market environment, and grow client accounts on a consistent basis.
So we did it.

Neural Networks and Deep Learning

Advanced Machine Learning Systems

Ongoing Maximum Trading Results

Artificial intelligence and machine learning represent the biggest leap forward in trading technology. Previously this technology was only available to large institutions and hedge funds, costing millions of dollars annually in programming and equipment.

A.I. Trading Technology

Deep Learning
Advanced deep learning studies the market, looking for opportunities to execute trades with the highest probability of success.
The deep learning module tests thousands of possible trades every second, tracking every result.
Traders benefits from the delivery of more accurate trades more often.

Neural Network
Neural Networks contribute to the learning capabilities of each of our custom designed algorithms.
Our algorithms learn from every trade. Their ability to learn and adapt to an evolving market is reinforced and enhanced by our deep learning.
The algorithms driving your trading constantly watch the markets and become smarter, faster, more efficient traders every day.

Adaptive Results
This process creates adaptive results: algorithms assessing market conditions, calculating potential moves and using experience to execute trades with the highest probability of profit.
The longer the system is in use, the more it learns from each trade and improves results.

Proven Experience
Our developers have been building institutional level deep learning and artificial intelligence platforms for over a decade. They know how to develop customized, adaptive algorithms with the ability to deliver the performance clients demand.
Enhanced Trading Consistency
All algorithms combine self-learning AI with deep learning capacity. The result: algorithms teach themselves to consistently become better, more accurate traders. Clients benefit by enjoying more consistent performance with smaller, shorter drawdowns.
Puts Average Traders on Equal Ground with Institutional Traders
True A.I. systems will outperform any Expert Advisor or rules-based system. Rules-based systems fail because they try to bend markets to fit their rules. A.I. evolves with the market, constantly studying and learning how to execute successful trades. Institutions learned this lesson and deployed progressively more advanced A.I. algorithms to boost their trading results.

A.I. Trading

Outperforms Every Other Methodology or Trading Approach
Traders experience failure with black box or manual systems and typical Expert Advisor programs. Regardless of how successful the rules-based system are initially, A.I. will eventually master it, and execute the system more often, more efficiently and more profitably than any human trader. Accordingly, every manual system and every trading strategy not built on a comparable A.I. will eventually become obsolete.

Our Mission:
To provide all traders the tools and technology to be successful in the markets
Our People:
Brian Ward – CEO
Brian studied computer programing and systems engineering at Sheridan College. From there he made the leap into the financial world, landing a position with the largest mutual fund company in the country.
In the world of entrepreneurship, his business focus has been on helping investors realize the best possible gains with the least amount of risk.
Brian’s long-term vision contributes to the ongoing development and delivery of top-quality, easy-to-use technology for all A.I. Trading Technology clients.

Hoy Jameson – COO
Hoy’s financial industry experience spans over 19 years. He was the founder of Satori Capital Management Inc., a registered Limited Market Dealer with the Ontario Security Commission, focused on Exempt Market Products for Accredited Investors. Hoy has advised on trade strategy and trading platform development in addition to risk management for offshore hedge funds and registered start-up funds for both Commodity Trading Advisors and Commodity Trading Managers in the U.S. and Canada.

Rito Jones – Chief Developer and CTO
Rito has wide-ranging experience as a professional quantitative trader, investment strategist, and technologist. He has served as consultant to several US-based hedge funds and previously held positions at Oracle and Tata Consultancy Services. He continues to serve as a professor at WorldQuant University. He is an alumni of Indian Institute of Technology (IIT) Mumbai and a member of Mensa.

Panagiotis Platis – Director of Business Development
Panagiotis has been in the financial services industry for 20 years, specializing in foreign exchange, commodities, and futures trading. He has performed currency conversions for major institutions and has worked for one of Canada’s largest FCM’s. Panagiotis gained his knowledge by advising clients about the pitfalls of standard trading methods. He brings his entrepreneurial spirit and business acumen to A.I. Trading Technology.

How can using artificial intelligence help my trading?
Artificial intelligence works by analyzing each aspect of a trade to uncover everything that makes a trade successful. It then builds on the patterns it sees in the markets, resulting in continually improving performance.
Are any institutions using A.I.? What are their results like?
Institutions rely heavily on A.I. for high frequency trading and for several other trading decisions and execution. Hedge funds, pension funds and other institutions are implementing A.I. solutions on a regular basis.
Do I have to give up control of my trading account?
No, you have full control of your account at all times. You can set the system to auto-trade for you or simply give you trade suggestions.
What kind of strategies can an A.I. algorithm execute?
A.I. algorithms can be taught to execute any type of trading strategy, and will likely improve the strategies performance significantly.

Posted by Judy Romero in Trading
7 steps to Increase Discipline and Master Your Trading Strategy

7 steps to Increase Discipline and Master Your Trading Strategy

In this article I will give you methods which will increase your trading discipline most of which are based on scientific discoveries which are unknown for most traders. This should enhance your ability to gain a trading edge over others competing in the same markets.

Many traders just use some indicators and price action formations and make random decisions based on that. But it doesn’t work and when you don’t have a plan then first you need to define how to trade. It is proven that you have some resources of energy which you use on making decisions. But there is little sense in using this energy every day on defining “how to trade”. You should use it only once (when you choose your strategy and create a trading plan) and save your energy on other important issues: analyzing setups, opening transactions, setting SL and managing your transactions. Unfortunately (or fortunately, because you can take advantage of it) most of traders waste their energy on defining how to trade and as a result often make poor decisions.

Trading

It is also important to consider that when you don’t have a plan then you make decisions which are somehow random. Because of that you always make them in a different context and you don’t learn from your mistakes. For example, taking a pin bar in some situations is good but in others it is not. When you don’t have a plan then you aren’t focused on this kind of important detail which defines if you are a loser or a winner.

If you just start using a strategy or don’t make money on an existing one then don’t include too many indicators and formations. It will make it too complicated for you and it will be harder to learn from your mistakes and start making money which leads to danger. When you start trading, or don’t have a positive experience with your existing strategy, then it is very easy for you to give up. It is therefore better to see some progress in your results and increase your motivation. Hence at the beginning don’t include more than one indicator and formation  in your strategy.

When you have a strategy then try not to give it up after first big loss. Of course taking a loss is unpleasant but you must sometimes initially lose to make more money in the future.

By changing your strategy too often you lose almost all of your experience gained by using your previous strategy. Hence if you just give up after the first big loss then you will never master your strategy.

Of course it may be that your strategy is unprofitable but it is often too early to determine this after taking one (even big) loss.

When you trade then you take different kinds of actions. You analyze markets, search for setups, open transactions and manage them. In fact each of these actions is a different step and you should think about each step separately.

Usually traders think that they are disciplined if they follow all of these steps, however, it can lead to decreasing your motivation. When you start learning something new then there is a tendency to make a lot of mistakes but you also make some progress. When you expect from yourself to be absolutely perfect then it is easy to focus on your failures and not seeing any progress leads to being less motivated.

It is also important to consider that when you think that you are disciplined only by following all steps from your strategy, then it is harder for you to spot your weak points. For example, imagine that you are good at analyzing charts and opening transactions but you wait too long with closing your losing transactions. Usually in this situation a trader will blame his or herself and think that he or she is an undisciplined loser. Blaming yourself or calling yourself a loser doesn’t give you anything and only decreases your motivation and self esteem. In fact in this situation you should be proud because you followed many important steps from your plan. Yes, you may have problems with closing your losing transactions but you should accept that, investigate yourself and find a reason of your failures.

You have a plan and you should also know exactly what are you going to do in any given situation so it can’t be vague. You can’t say “If I see a setup then I will think if it is good or not”. You should define exactly what a good setup is, what is not a good setup and how to define if it is good or not. Otherwise you will lose your time and energy on defining (in stressful conditions) what you should do and probably make poor trading decisions.

I previously suggested that you should divide your strategy into small steps. In addition to this you should also monitor your progress in any of these steps on paper as it will be beneficial for you in two ways in that you will see improvements and motivate yourself to an even bigger effort. You will also see where you have problems and it will be useful information for you that you need to correct something.

When you make any progress then you should reward yourself. Your progress doesn’t have to be big and could be enough if you have just opened your transaction when you should. It will make you proud of yourself and increase your motivation.

Rewarding yourself produces endorphins, (the hormones of happiness). It is how your brain convinces you to do something and in some situations it works, but in others it doesn’t. For example your brain produces endorphins when you watch, but are not engaged, in something exciting which may not be good because it doesn’t motivate you to take action. This process can be manipulated and used when you do something which is good for you.

How should you reward yourself? Well you may want to buy something but from my experience the best are inner rewards: just smile, applaud yourself or say “Good work”.

Posted by Judy Romero in Trading
Gold Trading for Beginners

Gold Trading for Beginners

Discovered at least 6000 years ago, gold still maintains its status today as a highly valuable metal. It is present in many artifacts created throughout history, as well as in beautiful jewelry passed down and traded through the ages.

But the value is not only tied to these feats of craftsmanship: gold has a role to play in the contemporary financial markets, mainly because it is a metal whose value is high and relatively stable over long periods of time. Because of these characteristics, it is an attractive option for investors in the capital markets.

Gold Trading

In the past, investing in gold was limited to people with great assets and capital. Today, thanks to the rise of the internet and the creation of online trading platforms and tools, everyone can access trading from any point in the world, regardless of financial constraints.

Your options when trading gold

Gold is treated as a currency in the capital markets. You can trade it just as you would pounds for dollars, or vice versa. Depending on the price changes during the day, traders can buy and sell gold and make a profit.

Contracts of difference (CFD)

One of the options offered by retail forex brokers are contracts of difference. In this setting, traders wage on the price changes of gold, keeping the profits when their predictions are confirmed in the markets. Since the investment is put on a wager, traders will never own physical gold but may still benefit from its market.

The main advantages of CFDs are that traders can enter the market with a lower investment, in a short term position, and that they’ll save money by not paying futures or for storing physical gold.

One thing to note is that this form of trading has its risks. The market changes quickly and frequently, leading to high volatility. This can create great gains but also great losses.

Exchange-Traded Funds (ETF)

An alternative to trading gold through contracts of difference, you can also choose futures, day trading or exchange traded funds. Like CFDs, these options don’t involve owning physical gold. ETFs are a collection of investments traded like stocks and can contain securities related to gold.

Gold futures give investors some leverage when trading gold, by contracting a future date and price to sell the commodity. The amount of capital needed to invest in futures is low. After all the investor’s funds are deposited on the broker’s account, he can then conduct large-scale investments that have the potential to have a better yield when compared to trading solo.

Market Analysis

Conducting market analysis is a vital process during the trading procedure. All retail traders must familiarize themselves with how the markets work before starting any trades.

In the particular case of gold, a trader must understand what can impact the price movements of the commodity, while observing past variations and prices. One of the factors that cause these changes are tied to supply and demand.

Gold Market

These two forces are very straightforward. When there is increased supply and reduced demand, the prices drop; then the opposite is true, more demand and less supply, the prices increase.

Additionally, whenever the world economy points to a slowdown or a recession, traders focus on gold trading as its value is relatively stable in the long-term. The tenser the economical, social or political circumstances become, the more investors turn to gold to assure future wealth.

Technical analysis is another way to understand how to trade gold effectively. By using trading tools and historical information, traders can create projections regarding the value of the commodity. These technical traders can also recognize conditions where too much gold was sold or bought. This knowledge can provide good indicators on when to assume buying or selling positions.

Considerations

The value of the Japanese Yen and of gold have a direct relationship. It’s common to see the value of gold rise at the same pace as the Yen, and vice versa. This relationship can be explained by the fact that the Japanese economy and financial system are perceived as dependable, the same perception that investors have of the value of gold. As a result, Yen and gold are a good safe place to store value during unpredictable periods.

Another currency in close relationship to gold is the U.S. dollar. But, unlike the case with the Japanese Yen, when the dollar is performing well, the prices of gold tend to drop. Conversely, when the dollar is losing value, gold prices rise.

When deciding how much to invest in gold, keep in mind that greater investments also increase your exposure to the market conditions for this commodity. While the potential to make good profit increases when you invest more capital, if the prices drop suddenly for any reason you will accumulate losses.

When you assign over 15% of your assets to valuable metals, you may lose the potential higher returns than other property classes might yield.

(Additional sources – The origins of gold: https://www.gold-traders.co.uk/gold-information/who-discovered-gold.asp)

Posted by Judy Romero in Investing, Investment, Trading
Day Trading is Finally Profitable

Day Trading is Finally Profitable

Day trading is the art of buying a selling stock over the course of the day at its low and high points, respectively, taking advantage of market volatility. Because of the nature of financial leverage and the rapid returns that are possible, day trading can be either extremely profitable or extremely unprofitable. Trading lore has it that the average day trader loses money in the markets. Some estimates put the proportion at 80% or even higher, when we think of the volatility of the markets it is not hard to believe that figure when the average day trader does not have a team of analysts providing researched trade ideas, does not have a team of IT and programming staff to support trading, and does not have access to the best trading software and news services.

There are many styles of day trading with specific qualities and risks.

  • Scalping is an intra-day technique that usually has the trader holding a position for a few minutes,
  • Shaving in a method which allows the trader to jump ahead by a tenth of a cent.
  • A full round trip is often completed in less than one second.

The major problem with day trading, as it’s currently known, is that the level of profit is extremely small. A day trader must make hundreds of trades per day, and must buy and sell at the right time in order to make any returns, and in many cases, the smallest error can be very costly. Thanks to OneTwoTrade, day trading is finally profitable.

StockMarket-Trade

The core principal behind day trading is simple: buy low, sell high. This strategy is easier said than done. How can one really know when the lowest point to buy is? And are you selling too soon? Did you wait too late? OneTwoTrade has eliminated the need for all those questions, and you no longer need to buy low and sell high. The only question you need to answer is; Do you think the price of an asset will increase or decrease by a predetermined expiry time?

OneTwoTrade is revolutionizing day trading by offering, high yields, quick profit turnover and fixed profit, well-known assets to trade, and low initial investment. Day trading Binary Options on OneTwoTrade is considered as one of the growing investments in the market and provides an opportunity to earn more income through day trading than ever before.

Your new day trading strategy is now simple

You place a trade by predicting whether or not you believe the price of an asset will go up or down. The old way of day trading brought in low returns – a trader would be lucky to make 10% in a month. Most day trading professionals make less than that figure, however, and only the very best traders can manage to make 100% profit on their portfolio over the course of a year.

Unlike traditional day trading, you can now profit on both the upswing and the downswing of an asset as your return is based on your prediction, rather than the assets performance. Binary Options on OneTwoTrade is fast becoming popular among the day trading community and gives the trader a chance to earn up to 80% profit of the original investment in as little as 15 minutes, the quickest form of return to the trader.

Best of all, your profit is fixed, so you make the same amount of profit if your asset moves in your predicted direction 1 point or more. Because the return is fixed between 60-80% depending on the asset, there is no need to leverage your trade like traditional day trading as profits are higher than traditional day trading, this also has the added advantage that you will never lose more than you invested so you know the level of risk before you enter the trade.

Experienced and professional traders can make profits of over 100% on their portfolio of assets in the course of 1 day, rather than 1 year. And, what’s more, because day trading has been simplified so radically, anyone with an interest in the markets can get in on the action and make tremendous profits from market volatility.

Traditional day trading also has the added drawback of the associated costs. Traders have to take this into account when trading so they make over and above what they need to cover these costs. Some day trading strategies require relatively sophisticated trading systems and software, which can cost in excess of $45,000. Many day traders also use multiple monitors or even multiple computers to execute their trades adding to their costs.
Day trading is only possible by going through a broker, who charges commission based on volume, so traders must make a larger volume of trades to take advantage of cheaper commissions. However, day trading on OneTwoTrade is completely free. With OneTwoTrade, there is no need for software download; everything is done online, there is no need for multiple monitors and we take no commission so any profit you make is 100% yours.

Don’t stick with old, obsolete day trading strategies and methodologies any longer when the chance to make higher returns more simply is just a click away. Visit OneTwoTrade and experience the profitability of day trading as it was intended.

Posted by Judy Romero in Investing, Stock Market, Trading
Face Your Day Trading Weaknesses with Change

Face Your Day Trading Weaknesses with Change

Today is February 1st and what a good way to start the first trading day of the month, +15 on the S&P and +118 on the Dow, but will it last?

Currently, the momentum on the daily charts is down and the 120 minute chart (2 hour) has just turned up today. The weekly chart is flirting with a turn in the momentum, but it has not happened yet. A lower weekly close and I am sure it will turn down. So, a pull back up for now, will bring a moment of pause to the market from this recent sell off. We could see a sizable move, if the market can get up over todays high with any conviction.

I do see some pretty strong over-head resistance just a couple of points higher from todays close. We very well may see a slight rise on the open, followed by a pull back down inside the range one more time, before we make another attempt to break out of the downtrend. We will see what tomorrow brings, it should be good. I think the price action is going to get better, with good swings in both directions.

I did not post anything for Fridays session, I had company over the weekend, but I will post a video managing Fridays last trade + 5 S&P points and show my results for the rest of that day.

tradingchart

In todays trading, I did pretty good. I could have had all winners, but I did not take enough time after a break I took, to better accurately see where we were and likely to go, resulting in a loose of one point. Other than that, I had several trades that I scaled out of the positions for multiple point gains and a few 1 pointers or so. It’s in the video below if you care to take a look.

I was going to stop after my first three trades, which was plenty for my daily goal, enough for even the high side. After taking a break for about an hour, I thought to come back for another session. I don’t always do this and I don’t always recommend traders trade all day or even most of the day, because fatigue can set in and the likelihood for making mistakes goes up.

If I do come back, I almost always cut my size down. That way, if I have losses, it is not going to impact my gains as big a degree. If I have additional gains, it only gets added on for nice day. This is a conservative approach and is recommended if you already have made your daily goal.

We have all heard of “Money Management” and how important it is. It is true. If you increase your size when you are not trading well, you make everything harder, not easier. Traders often try to get back what they lost by doing so, which is one reason of many, that most don’t make it. I hope that is not the case for those who take the time to read my trading blog. I try to give a mix of different idea’s, thoughts and insight into a day traders world.

Most of us pursue this business because we love it. We love it for the opportunities that it can bring as well as many other reasons.  Some traders want to make it ($) fast and lots of it. I don’t recommend that either. If you go to fast, you only speed the process up to the point where you will again make mistakes, loosing the hope you had when you first started out. You can’t change past trading mistakes that we all make, but we can try to uncover what it is we just did, why we did it and what are we going to do to change. If we don’t take all three of those seriously, we will only come back another day and repeat the same trading mistakes all over again.

I was watching a movie recently where a patient was seeing a doctor. He told him, it hurts when I do this. The Doctor then said, if it hurts when you do that, then don’t do it. We don’t like it when we take losses that are not apart of our plan, strategy or method, but your first loss is best. Why is it that we to often take trades that don’t fit our model. Lack of patients is one of them. I admit, I don’t have all the patients I could use sometimes while trading. That is why I trade small time frames. I don’t have to wait to long for another trade to come my way. If you are trading 15 minute  bars or even 5 price bars, you may have to wait for some time.

The point is, everyone is different and we all need to find our strengths and weaknesses. If you know what your are strong in, work on making it better. The area’s of weakness, take extra time and reflect what is holding you back. To often, it is in our minds. I am serious. There are a lot of good traders out there that are just an inch away from bringing it all together. They just need a little help, guidance and support.

Let me give you two things that can really help those who feel that you are so close to bringing consistent profitability to light. I know of and have heard of traders who have done this and they say, it is the best thing they could have done. I have talked before about how important the mind is and to often, how we see ourselves inside, gets transferred outside. If you don’t have the inside part right we only work against every good thing we try to bring to the trading screen.

There are many ways to go about thinking the right way, not only when we trade but throughout the day. I can see that I am close to my typing limit and I will probably just wait until tomorrow to better give you the right background on this. If traders take this seriously, I truly believe it will help some if not many bring up there, BOTTOM LINE.

Posted by Judy Romero in Investing, Trading
Why You Need to Understand Stock Float

Why You Need to Understand Stock Float

The stock float is one of the metrics that have the power to greatly influence the price of the stock. So make sure you get familiar with it if you plan to become a trader.

What Is a Stock Float?

To put it simply, the float of a certain stock is the measure of the number of shares that can actually be traded. So in a way, this metric is actually a measure of liquidity. And understanding the float allows the traders to predict the potential volatility of the stock.

General Recommendations Regarding Stock Float

If a stock has a high float, that means that it is more likely for traders to accurately predict its behavior. A large number of tradable shares means that the liquidity of the stock can support significant moves. With high-float stocks, such moves don’t impact the stock too much. However, low-float stocks can experience moves as huge as 40%.

For that reason, it is not always the best idea to trade low-float stocks. The price is reactive and the stock itself can be very volatile. That is especially true during the formative years of the life of a company.

A trader who knows what to look for can measure the goodwill of a company by looking at the float. Moreover, even a novice can measure the interest of the public in the stock. So in most cases, it is advisable to trade high-float stocks.

What Are the Differences Between Free-Float Market Cap and Market Cap

We can’t talk about the stock float without mentioning market capitalization. When you first start researching stocks, you might notice that company categories revolve around the market caps of those companies.

In essence, the market capitalization is a measure of the size of a company. Basically, it is the total value of the outstanding shares of stocks of a company. Those shares include both the publicly traded shares and the shares that are held by insiders.

Calculating the market capitalization of a company is rather straightforward. All you have to do is multiply the number of the outstanding shares of a company by the stock price. Allow us to illustrate with a simple example.

Let’s imagine a nameless company that has 100 shares outstanding. Now, let’s imagine that the company is trading at a stock price of $5. We can now calculate the market share by simply multiplying those two numbers. In our case, the number comes out at $500. Naturally, no company will trade with only 100 shares. In fact, stocks that have a market value of fewer than 250 million dollars are considered to be micro-cap stocks. And to enter a large-cap stock category, companies have to have a market value of over 10 billion dollars.

Now that we have an understanding of what market capitalization is, we can look back at the float. The float only numbers the outstanding shares that the public can trade. That means that the restricted stocks don’t enter the float.

To calculate the float of a company, we have to remove the inside trading shares. After all, they are of no use to the public, and they do reduce the liquidity of the stock. For that reason, major indexes prefer measuring the free float instead of the market cap.

Manipulating the Stock Price with Float

The market follows the rules of supply and demand. So if there are fewer shares available while the demand doesn’t change, the price will go up. And as the float is the measure of shares that the public can trade, people start wondering if the company can manipulate the float and thus impact the stock price.

While high-float stocks are more attractive for traders, reducing the float will actually increase the price. Studies have shown that companies are capable of manipulating the float to impact the price of a stock.

stock float manipulation

Companies can increase the float by issuing new shares. Conversely, they can reduce it by organizing a share buyback. Alternatively, some companies can use a stock split to impact the float.

Another way for companies to influence the float is through insider activity. In the case of a significant number of exercised options, the insider actions can change the stock float.

Furthermore, companies can simply choose to increase the float by selling inside shares. In most cases, companies do so in order to raise cash. However, that doesn’t exclude the possibility of ulterior motives.

And for that reason, investors should be wary of potential manipulations.

Posted by Judy Romero in Investing, Stock Market, Trading

Day Trading 101: Use These Strategies to Make a Profit

Day traders are those that buy and sell an instrument during the same day. Some even do it many times over the duration of the day. That way, they can easily profit from the price movements that occur during the day. However, this type of trading is not without risks. While it can be a lucrative venture, lack of knowledge or experience can cost you a lot of money.  That is why you should, at least in the beginning, stick to the tried-and-true strategies and methods. That’s why we will take a look at some principles you should definitely adhere to. So, to help you on your way, we will go over the top ten day trading tips for beginners. First things first, make sure you have a solid broker like Ally Invest. You’ll also want to make sure you have access to a quality trading platform.

Top 10 Tips

1. Do Your Homework:

Remember, knowledge is power. And not just knowledge of how trading works. If you want to be successful, you have to follow the stock market news and any event that can affect the market. Use any information you can find. Always make sure to do your homework. That includes making a list of stocks you would like to buy, informing yourself about that stock on a regular basis and keeping up with the news. You should also visit trustworthy websites with reliable financial information as often as you can.

2. Set Aside The Amount of Money You Are Willing to Spend:

You should know how much money you are willing to risk in each trade before even starting your day. We would recommend setting aside the amount that is no bigger than 1-2 percent of your account. Remember, you will lose money in trades, no matter how good you are. Remember, even Warren Buffett doesn’t have a 100% success rate. And you don’t want to risk a large percent of your account on a single trade. So, make sure to set aside the money you can trade with. And be ready to lose that money. We are not saying you shouldn’t be optimistic, but don’t take away from the money you require for your living expenses.

3. Make Sure You Have Enough Time

Day trading can, without a doubt, be a very lucrative trading style. However, you should bear in mind that it will take up most your day. If you don’t have a lot of spare time, you should consider a slower trading style. Reacting to the market movement is crucial and missing out due to the lack of time can cost you a lot of money.

4. Don’t Overdo it

As a newcomer in the world of trading, you should remember not to make too many trades in a day. So, try to focus on a couple of stocks for the first few weeks, at least until you get some experience.

5. Avoid Penny Stocks

We understand that trading low-cost stocks seems ideal for a new trader. However, penny stocks usually lack liquidity, and it is not easy to make a profit with them as a beginner.

6. Let Others Trade First

Day trading can be very volatile, and this is very noticeable during the first 15 minutes of each trading day. A lot of people will execute their orders as soon as the market opens. And this practice increases the volatility of the market. Once you have some experience behind you, you will be able to profit from this volatility. However, until then, you should avoid the rush hour and trade during the milder moments of the day. Take your time, and read the movement of the market.

7. Use Limit Orders to Cut Your Losses

There are two main types of orders you should use as you are starting out – market orders and limit orders. Market orders guarantee execution, however, they don’t guarantee the price. This order executes the trade at the best price it can get at the moment. On the other hand, limit orders demand the right price but don’t guarantee the execution. Use limit orders to trade with precision and set the price you want. Make sure to set realistic prices for trading to avoid missing out on the trade.

8. Keep Your Expectations in Check

Some people imagine that every single trade has to be a win to make a profit. Others expect incredible outcomes after just a couple of trades. And, we have to tell you, neither of those is necessarily true. In fact, many successful traders have success rates that barely go over the 50% mark. However, they focus on making more money on winning trades than they lose on their losing ones. That is why risk management is one of the most important aspects of trading. So, don’t get discouraged if some of your trades end up losing you money. Just take your time and develop a strategy that lets you get more than you lose.

9. Control Your Emotional Response

Trading in the stock market can get very emotional. You might get overly optimistic, hopeful or fearful, depending on the day. But don’t let your emotions take the lead. In the end, use your logic to make the decisions.

10. Always Stick to Your Plan

Make sure you have a plan before you start placing orders, and stick to it. As a day trader, you will have to move fast to grab a good trade. However, you don’t have to put yourself in the position where you have to make snap decisions. Don’t blindly chase profits if that trade goes against your overall plan. Instead, develop your formula and follow it as closely as you can.

Buying For Beginners

As a day trader, you will try to make a profit by using the small price movements during the day. However, there are factors you should always consider when entering a trade. Typically, you should look for liquidity, volatility, and trading volume of a stock. Allow us to explain:

* Liquidity – Stocks with a lot of liquidity usually have tight spreads. That means that you can both enter and exit a position with a good price.

* Volatility – Volatility is a measure of the price movement of a stock. If a stock is very volatile, it means you can gain, or lose, more money.

* Trading Volume – This measure will tell you how many times a stock has been traded in a certain time period. Usually, you should check for a period of one day. You can use this to measure the interest in a certain stock. If the volume increases, it usually means that the price will change too.

Once you have a grasp of these measures, it is time to find what your entry point should be. For this, you should use the following three tools:

* ECN/Level 2 Quotes: ECNs represent the electronic network that will automatically execute orders for you. Level 2 quotes are a service that will get you price quotes from NASDAQ and OTC securities. Use these two in conjunction to vastly improve your chances. It might take you some time to get a good handle on how to use these.

* Live News: Stock prices are always changing. And one of the biggest catalysts for that are news. Subscribe to real-time services to make sure you are in the loop.

* Candlestick Charts: Use these charts to analyze action prices. More on them later.

Selling For Beginners

Once you find the stock you want to buy, it is time to make a plan for the exit point. Namely, identify your price target. Once the stock reaches that target, leave the position. There are numerous strategies when it comes to price targets. Let’s go through them:

Scalping: This is probably the quickest strategy to perform. And, for that reason, it is one of the most popular ones. With this strategy, your price target is met as soon as the trade becomes profitable for you. In essence, you set the price target by planning to sell as soon as the numbers show you will make any money.

Fading: If you see a stock experience several rapid upward moves due to overbuying, you should consider this strategy.  As soon as the stock spikes, the early buyers will start turning profits, and others will avoid the higher price. So, once it goes up, you start shorting the stock to turn a profit from the subsequent price drop. This strategy is risky, but it can be very profitable. Set the price target as the moment new buyers start buying the stock at the lower price.

Daily Pivots: With this strategy, you will be looking to profit from the volatility of the stock. Follow the price patterns of stocks and notice when the prices are at their lowest. Buy at that point, and sell when they are at their highest. Set the price target at first signs of reversals.

Momentum: If you opt for this strategy, follow the news closely. Your goal is to recognize the news that will trigger an increasing trading volume of a stock. Buy on the release of the news and sell once the volume starts decreasing.

The Candlestick Chart

We said that you should use the candlestick chart to find your entry point. Well, this is how to do it. Start by focusing on patterns, technical analysis, and volumes. Of course, there are way too many setups you could run for us to instantly cover. However, one of the most reliable ones is the doji reversal pattern. The doji candle is the one that is signaling the reversal. This is how you can try to confirm this pattern:

  1. The first confirmation is a volume spike. The spike shows that there are traders that will support the price. The spike can be on the doji candle or on those that come immediately after.
  2. Check if the prior support levels match up.
  3. Check the level 2 to see what the open orders have to say.

Margin Trading and Stop Losses

As a margin trader, you will be borrowing the funds for your investments from a brokerage. If you become a margin trader (which is not easy), you will be vulnerable to sudden price movements. In essence, margins amplify trading results. So, if you make a profit, it will be bigger. However, the same goes for your losses too. So, using stop-loss orders is crucial for day traders.

This type of order will greatly reduce your risks. And, you can set the stop-loss to any metric you want. If you are entering a long position, set it just below a recent low point in price. Or, if you decide to enter a short position, set it above a recent high.

Alternatively, if you are afraid of market volatility, you can design a stop-loss order that will protect you from it. If the stock’s price is moving up and down every minute, you can place a stop loss at a certain distance away from your entry point. Make sure to leave some breathing room as the price fluctuates.

We should also mention that a lot of traders like setting up two stop-losses. A physical stop loss is the one you place at the point at which you would lose the most money you are willing to risk on this trade. A mental stop loss is the one you set at the point where the movement breaks your entry criteria. In essence, you set it up to exit the position the moment your trade makes an unwanted turn. Just make sure that the exit criteria are very specific.

Final Remarks

Mastering day trading can be a daunting task. It will take a lot of time and discipline on your end. In fact, many who try to do it either fail or give up. The fast-paced environment and the pressure that comes with it can prove to be too much for a lot of traders. But, if you utilize the tips and strategies you can find above, you might make a strategy that will turn a profit. After you get enough experience to be a consistent trader, you should be able to beat the odds. And, if it gets tough, just bear in mind that you can always try again tomorrow.

Posted by Judy Romero in Trading

Day Trading Guide

There is a reason every brokerage desires to have as many active or day traders as possible. They usually have a lot of experience and don’t require a lot of assistance compared to newcomers, not to mention that they generate a lot of revenue for the brokers every day. Of course, the terms don’t have strict definitions. So, how many trades do you have to make to become a “day trader” or an “active” one?

We did speak to a number of brokerages, experts, and investors to see if there is a definitive answer. And, it does seem like there isn’t an exact number where “active trading” starts, especially since every broker seems to have a different set of rules when it comes to that. Rules that usually depend on their prices and costs. In fact, one of the brokers who deals with active traders even thought up a new term of “hyperactive trading.” The broker in question is Lightspeed, and they believe that people overuse the term “active trading.” So, they distinguish between active traders and hyperactive ones. The former would be those who place 10 or more trades per month, while the latter would be those who place at least ten times that volume.

So, let’s take those numbers and go with them. To become an active trader, you would have to place around 120 trades, or more, every year. However, to qualify to become a hyperactive trader, the number is much larger. You would have to place at least 1,200 trades per year or more. So, figure out in which of these two categories you fit in better before you go on to choose your broker.
Top 5 Platforms for Day Trading
As we have said, in order to choose the best broker for yourself, you need to understand where you fit in. If you are an active trader, paying up to 7 dollars per trade should be acceptable. Finding a low-fee service is desirable, but you also require a platform that has a lot of features. After all, research is fundamental in trading. That means that you should be willing to pay a bit more per trade for access to those features.

On the other hand, if you are a hyperactive trader, it is not as important. We spoke to a number of hyperactive traders, and they say that the costs and the speed of execution are the most important factors. They believe that flashy tools and intricate research are simply not that crucial to them. So, when we were making our list of the best day trading platforms, we kept those in our minds. But, without further ado, these are our five picks for day traders.
5. Fidelity – 9/10
4. TD Ameritrade – 9/10
3. Lightspeed – 10/10
2. TradeStation – 10/10
1. Interactive Brokers – 10/10
Let’s start out with our number one pick for this list. Interactive Broker is a clear winner when it comes to the needs of day traders. This broker caters to both subcategories of active traders. If you choose them, you won’t find a beginner friendly platform. In fact, we wouldn’t recommend it for new investors. And it doesn’t boast impressive research features. However, you will see that they have everything you need for day trading. Highly customizable hotkeys that you can program for a variety of actions. Pre-set order types that will let you place any imaginable trade. They even include algorithmic orders in there. And, they offer the lowest margin rates you will find. Not to mention that their commissions are the most affordable in the industry. All of this makes the platform also popular among hedge funds and institutional traders.

We should also mention that this broker, along with Lightspeed and TradeStation, offers something called “unbundled” rates. That term refers to rates that include all of the rebates the brokerages get for your trades. In essence, a lot of exchanges will offer rebates to your brokerage for routing your transactions to them. And these three brokers will pass every penny of those rebates on to you. Now, to be fair, these rebates are relatively small amounts of money. Usually, you would have to go through 10 shares to get a single penny. However, after a year of trading, the numbers add up. In essence, these rebates will reduce the amount of money you have to pay per trade.

Let’s use Lightspeed as an example. If you’re using Lightspeed to trade a 1,000 shares on the NYSE, the rebate will be 0.14 pennies per share. At the same time, the commission rate you pay to Lightspeed is 0.45 pennies per share. So, trading a thousand shares would end up costing you $3.10 instead of $4.50. Now, if you are a hyperactive trader with 2,000 trades per year, this can add up to $2,800 of a difference in that year alone.

On the other hand, you could go with one of our other top brokers. TradeStation, for example, has three different structures when it comes to commissions. TD Ameritrade boasts the thinkorswim desktop platform which is basically second to none, and a mobile app to boot. And Fidelity is on the list thanks to their order execution quality.
Tips for Choosing Your Broker
Overall, finding the perfect broker for your needs mostly depends on how you plan to trade. For starters, decide how many trades you plan on making per year in advance. Then, try to decide between powerful tools and low commissions. And, don’t forget to check the minimum deposit values. In the end, the rest is up to you.

Posted by Judy Romero in Trading

Getting Started: The Balance Sheet

Are you new to trading and want to master the basics? Well, we would recommend learning about the balance sheet as soon as you can. It can be a useful tool that will help you make trading decisions.

What is the Balance Sheet?

If you spend some time in trading chat rooms, you will inevitably hear about balance sheets. And, you will probably notice that a lot of people pay close attention when someone brings it up. Well, they do so for a reason. But why?

To put it simply, the balance sheet is one of the primary financial statements of a company. In fact, it is one of the most useful documents you can put to use while evaluating a firm. Its job is to inform you, as an investor, of the financial standing of the company.

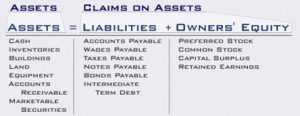
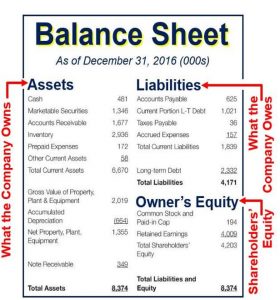
There are two main sections in a balance sheet.  The first one (usually on the left-hand side) is there to inform you about the assets. This section will include anything that the company owns that has actual financial value.

The second one (usually on the right-hand side) is for liabilities and equity of shareholders. Liabilities present the company’s debt. Most commonly, they refer to bond issues and bank loans. However, anything that the firm owes to someone is a liability.

Owners’ equity (or stockholders’/shareholders’ equity), on the other hand, consists of the stock of the company and the income it holds from operations. This income is known as retained earnings. The company can use liabilities, its stock, or owners’ equity to purchase assets. So, if we were to present the balance sheet in an equation, it would look like this:

Shareholders’ Equity + Liabilities = Assets

This equation is one of the original concepts accountants have been using for a long time. To put it in words, assets of a company are equal to the liabilities of a company plus the shareholder’s equity. And, it does make sense. Allow us to simplify. In order to buy something, a company has to pay for it. In order to do so, they either have to use their earnings, sell stock in the same value, or take out a loan. And, of course, this simple equation works for every single company. No matter how big it gets or how small it starts. In fact, you can even apply the formula to a lemonade stand your neighbor’s kid is running.

Allow us to demonstrate: Let’s say the child spent 10 dollars to make the lemonade stand. Let’s also say that it got a 10 dollar loan from the parents to buy lemons, sugar, and straws. With that situation in mind, let’s make a simple balance sheet.

Assets

Supplies: 10 dollars

Property: 10 dollars

Total Assets: 20 dollars

Liabilities and Shareholders’ Equity

Liabilities: 10 dollars

Shareholders’ Equity: 10 dollars

So, let’s take a look at this basic balance sheet to figure out how it works. The kid spends the 20 dollars on the business overall and has no cash at the moment. However, the “books” still show 20 dollars in assets. After all, the supplies for making the lemonade are still all there. The kid owes the parents 10 dollars, which are there as a liability. And lastly, as the owner, or the sole stockholder, the “company” has 10 dollars of equity. Hopefully, this example was helpful. Now that we can grasp the basics of balance sheets let’s delve a bit deeper into the details.

The Assets

Our example was very simple, but in the real world, it can get a bit more complicated than that. So, let’s go through some common assets. The most common examples are cash, inventory, property, plant and equipment (PPE), accounts receivable, and goodwill. Now, most people will instinctively understand a couple of these terms. However, other items on the list are not quite as self-explanatory as cash or inventory – for example, account receivable. It is an item that represents liabilities that clients owe to the company. Since they represent the money that others owe to the company, they are that company’s assets. PP&E is the account that summarizes all of the property the company has, the plants it uses for manufacture and any equipment it owns.

You can further classify assets as current or noncurrent assets. The current ones are those that the company will use up in one year (for most companies, the year is the length of one business cycle) or the assets that the company can easily convert to cash. The noncurrent ones, on the other hand, are those that are going to remain on the balance sheet for longer. An example of noncurrent assets is the land the company owns.

But, is it possible to have too many assets? Actually, it is. Bear in mind that the company has to pay for every asset with its equity or through liabilities. Especially if the company is buying unnecessary assets. That can lead to increasingly difficult debt or devaluation of the stocks as they are overselling. And, if the company is buying too many assets, the investors might lose money through devaluation of their holdings.

Also, having stagnant assets can increase the costs of operation, and thus reduce the profit margins. While most assets are a good thing, there are those that the company won’t be able to sell. And, not only does the upkeep cost rise the more stagnant inventory you have, but it takes more time to move it. And, over time, the inventory might become obsolete and lose value. So, make sure to check the inventory turnover if you see a company that has a lot of assets.

You should also bear in mind that certain assets (like PP&E) will depreciate as years go by.  For example, if a company buys a building for 10 million dollars, and plans to use it for 10 years with no residual value, the depreciation rate would be 1 million dollars per year.

The Liabilities

While liabilities represent the debt of the company, they aren’t necessarily a bad thing. After all, they allow the company to buy assets they otherwise would not be able to afford. In fact, almost every single large company in the world has had debt in their books. And, it makes sense in the short term – borrowing money is a great way to improve your business.

Most common liabilities are bonds payable, mortgages, and accounts payable. However, even if you find a company with little to no liabilities on the balance sheet, it doesn’t mean you have found a company that has no financial obligations. Some companies might try to hide their debts by rewording the balance sheet. So, keep your eyes open to see if the footnotes of the financial statement hide something you should know about. Sometimes, the company might list debts as “operating leases” or “other transactions.” In fact, while there is no reason to hide existing assets, it could be appealing for companies to hide liabilities. Just remember the Enron scandal.

And lastly, always check if there are red flags when it comes to company’s debt. The last thing you want is to be an investor in a company that is about to default on its debt.

The Shareholders’ Equity

This is one of the trickier sections of the balance sheet. There are multiple topics that affect this section, and they require some knowledge to understand fully. Some of these topics are multiple stock classes, equity financing, subsidiaries, and many others. So, make sure to take the time and go over this section in detail if you are an investor in the company. This part of the balance sheet is the part where the company speaks about what you own.

The Limitations of The Balance Sheet

While balance sheets are definitely useful, they have their limitations, depending on what you want from them. First of all, balance sheets are financial statements, and, as such, they follow the guidelines GAAP and the FASB set up. So, why do we mention that? Well, primarily because the balance sheet doesn’t show the fair value of most items. That is mostly due to the practice in the accounting industry referred to as lower of cost or market.

This practice dictates that the accountant recording the asset uses the lower of two values between the fair value and the cost of the asset. This way, the accountant can’t inflate the numbers it records on the balance sheet. Let’s go back to that lemonade stand. When it makes lemonade out of the ingredients worth 10 dollars, the lemonade itself is worth a lot more. So, the kid expects to sell the inventory for 50 dollars instead. That means that while the cost was 10 dollars, the market value is 50. However, the balance sheet will still show that the “company” has 10 dollars worth of assets.

If the company ever sold all of the assets, the result would not be equal to the balance sheet numbers.

Maintaining the Balance

Financial statements can be quite intimidating. In fact, not all investors take the time to investigate them. However, they can be incredibly powerful tools for analysis. And the Balance Sheet is one of the financial statements that you can investigate even when you don’t have a lot of time. It holds a lot of information you can successfully use to predict what the future holds for the company. Just remember – there is a learning curve to investigating these statements. So, make sure to take your time and develop your knowledge.

Posted by Judy Romero in Trading
Building Blocks for a Better Portfolio

Building Blocks for a Better Portfolio

There’s a big change coming in the second half of 2016 and you might not even be aware of it.

Manufacturing and construction, two of the building blocks of the U.S. economy, are on the upswing.

Why should you care? After all, manufacturing is just 10% of the overall U.S. economy now.

But it has such a big psychological impact when it is doing well, that optimism in manufacturing has the ability to really light a fire under the rest of the economy.

Construction, which has been in the doldrums since the housing bust, can have a similar impact. It provides thousands of good paying jobs over long periods.

If both manufacturing and construction are humming at the same time, the U.S. economy becomes virtually unstoppable.

We could be in for a whole new paradigm in the second half of 2016.

The Manufacturing Turnaround

With oil in the midst of its worst price plunge of the last 50 years and China slowing, U.S. manufacturing slowed in 2015 as well.

For 5 months, American manufacturing was in a slump. The ISM for Manufacturing was in contraction, with readings under 50, from October 2015 through February 2016. Many were calling this a “manufacturing recession” complete with job lay offs, especially in the energy sector.

In February, however, crude prices bottomed and reversed course.

I don’t think it’s a coincidence that oil and manufacturing bottomed at the same time.

Take a look at this chart for the ISM for manufacturing since 2013.

It’s not surprising that it started to weaken in 2014, just as crude prices did, and then slumped right into the worst of the crude sell off.

For 4 straight months, manufacturing has picked up steam with June 2016’s reading of 53.2 the highest since February of last year. New orders, at 57, were the highest since March.

All indicators are pointing to manufacturing gaining strength.

Is it out of the woods? Is the manufacturing recession over?

Some indicators in the index continue to remain weak, such as employment. While employment is rising, the numbers indicate that companies are being cautious in adding new members to the team.

This would be normal, however, given the length, and severity, of the downturn. It’s going to take more than a few turnaround months for the companies to believe that the strength is here to stay.

Better Portfolio

Construction Continues to Pick-Up

The construction industry is made up of three segments: residential, non-residential and public.

This is an important distinction to remember because most people pay attention only to residential activity but non-residential and public construction are also big drivers of the economy.

Since the 2008 housing bust, new construction in the housing market has been well below the average seen in the last decade. Of course, that was distorted by the bubble.

Single family and multifamily construction, however, has been on the upswing. They are moving in the right direction.

Multifamily, in particular, has been extremely hot in the last few years although most of that has been concentrated in 12 major metropolitan areas in the form of luxury apartment buildings.

Since 2010, construction starts, for all three segments, have shown annual year over year gains including a 10% gain in 2015.

Big Projects are Heating Up

In May, the $3.8 billion Dakota Access Pipeline was started. It will stretch across several states including North Dakota, South Dakota, Iowa and Illinois. It will connect the Baaken to existing pipelines in Illinois.

This is a big project in an area that has seen lots of layoffs due to the crude plunge.

Highway and bridge construction also increased in May thanks to the passage in late 2015 of the new transportation bill.

In June, according to the Dodge Momentum Index, which tracks construction starts across the country, 14 new projects worth $100 million or more entered the planning stages in the month, nearly double that of May.

Since these are just planning, or starting, that would indicate the construction spending will rise later in the year and into 2017 as these projects get underway.

Low Rates Means More Construction

The construction environment remains favorable for the remainder of this year.

Long term interest rates remain low which means its cheap for builders to borrow and the banks are wide open to lending right now. One area of caution, however, is in multifamily construction where some banks are tightening lending in over saturated markets like Houston.

States are also able to finance construction through bond measures which means more construction in the months to come.

The Federal government may be likely to spend even more money on infrastructure, depending on the tone and direction of the election. Donald Trump has pushed transportation infrastructure spending in his agenda, in the form of new airports and roads.

Non-residential construction is now just below the 2009 peak and it still has upward momentum.

Residential construction is also moving in the right direction. I don’t expect it to approach the bubble highs, if ever, for quite some time as that demand was artificially inflated. But the millennials are a big generation and they will need housing, especially in the urban areas.

The Building Blocks

Manufacturing and construction are two of the building blocks that the U.S. economy needs to pick up steam.

They are also being ignored by investors. Now is the time to start snooping around in these sectors. I’m expecting the earnings estimates to continue to rise over the next few months which means better Zacks Ranks.

1. How to Play Manufacturing

“Manufacturing” can mean a lot of different things from the pure play big industrial manufacturers with global reach to the company that is making washers to ship to the Home Depot.

I like to play this area by buying the chemical companies. It’s the chemical companies that make the products that go into many of the manufacturers end-products. You start with the chemistry first.

The chemical companies are also a large, diverse group so it can be overwhelming, but I started by looking for the best, high ranked Zacks stocks.

1. Koppers Holdings (KOP)

I discovered Koppers when the corporate insiders bought a bunch of shares two months ago. The shares were already trading near a new high when the insiders jumped in which means they had to have a lot of confidence that things were turning around at the company to buy in.

Koppers is a small cap company that makes carbon compounds and commercial wood treatment products, especially for the railroad industry.

It is really focused on its Performance chemicals segment, especially that used in railroad maintenance and on home roofs. An improving housing market actually benefits Koppers as well.

Koppers is a Zacks Rank #1 (Strong Buy). Shares are trading at 16x despite the shares being at new record highs. This is still an attractive valuation especially given its expected earnings growth.

2016 earnings are forecast to rise 27.7% and another 29.7% in 2017. Not too shabby.

2. Trinseo S.A. (TSE)

Trinseo is a mid-cap company specializing in emulsion polymers and plastics. It used to be part of Dow before being spun-off.

Its key end markets are rubber, latex and plastics and it also has a big styrene business.

Shares were on a wild ride after the Brexit on fears that the European business would be hit, but UK revenue, as a total of the entire business, is under 5%. So it’s a little too early to have a full scale panic.

The stock is dirt cheap. It trades with a forward P/E of just 6.9.

It’s also one of those chemical companies that has been around forever so it rewards shareholders. Trinseo pays a dividend currently yielding a healthy 2.7%.

Trinseo is a Zacks Rank #2 (Buy). Earnings are expected to rise 42.4% this year, with a big chunk of that based on strong styrene margins.

2. How to Play Construction

In making a plan to get into the construction industry, your first instinct may be to buy the home builder stocks or builder ETFs.

Yes, that would give you exposure to the residential side of the construction industry.

But I don’t believe that’s where the big gains are going to be made.

There are plenty of big infrastructure projects going on, such as the Dakota Access Pipeline I discussed above, which specialty construction firms will be a part of. Look to the general contractors for opportunities.

There are several top picks in this space. These companies cover different aspects of the construction industry.

For instance, Zacks Rank #1 (Strong Buy) Dycom Industries (DY) is a big player in wireless infrastructure.

MasTec Inc. (MTZ), also a Zacks Rank #1 (Strong Buy) is big in communications and pipelines. It will be involved in the building of the $3.8 billion Dakota Access Pipeline.

Neither of these stocks are cheap, even though fundamentals are strong. Dycom is trading at 21x while MasTec has a forward P/E of 18.

My best pick in this area, however, has both double digit growth as the others do, but also has really cheap fundamentals.

3. Tutor Perini (TPC)

Tutor Perini is a $1.2 billion market cap general contracting firm that works on subways, tunnels, sports stadium and other big infrastructure projects.

As of Mar 31, 2016 it has a near record backlog of $8.2 billion, up 9% year over year. That’s the largest backlog since the third quarter of 2008.

It continues to get new projects. It recently won a $100 million contract for the expansion of the Maryland Live! Casino.

After a lackluster 2015, the company has really turned it around on the growth front. Earnings for 2016 are expected to jump 76.2% and another 16.5% in 2017.

Shares are cheap even though they’ve been hitting new 52-week highs. Tutor Perini trades with a forward P/E of 11.6. It doesn’t pay a dividend.

Tutor Perini is a Zacks Rank #3 (Hold).

Think Expansion, Not Contraction

What if the economy is actually starting to gain steam, instead of losing it?

Construction and manufacturing is where you want to be coming out of a slowdown. They are the first to reap the benefits of a growing economy.

With record low interest rates and a solid job market, I’m bullish on America in the second half of 2016.

The strong double digit growth rates for all of these companies show that the analysts are bullish too. Keep an open mind on value opportunities. They are always out there somewhere, even when the stock indexes are hitting record highs.

Happy Investing.

Posted by Judy Romero in Investment, Stock Market, Trading